Providing third-party objective image quality testing to meet your needs.
Leave the IQ lab work to our image quality experts. We know that each test lab setup is unique to the needs of your company—contact us today and one of our engineers will get in touch with you about your project.
Imatest can cater your test lab service goals:
- Our customized service achieves the testing objectives of your organization while working within your budget.
- Trained consultants will spend time with your team to better understand your needs and create a test plan to meet your project goals.
- Our detail-oriented engineers will test your equipment using our hardware, charts, and software to analyze images and interpret results—saving you time and resources.
- Provide consistent, repeatable, and trustworthy results through rigorous testing protocols, allowing you to build a portfolio of reports.
Explore our current test offerings:
Chart-Based Testing
Choose from our most highly recommended charts, based on your application and metrics of interest.
You get all of the data, Imatest software plots and results files (JSON/CSV), and the INI settings used to generate your results.
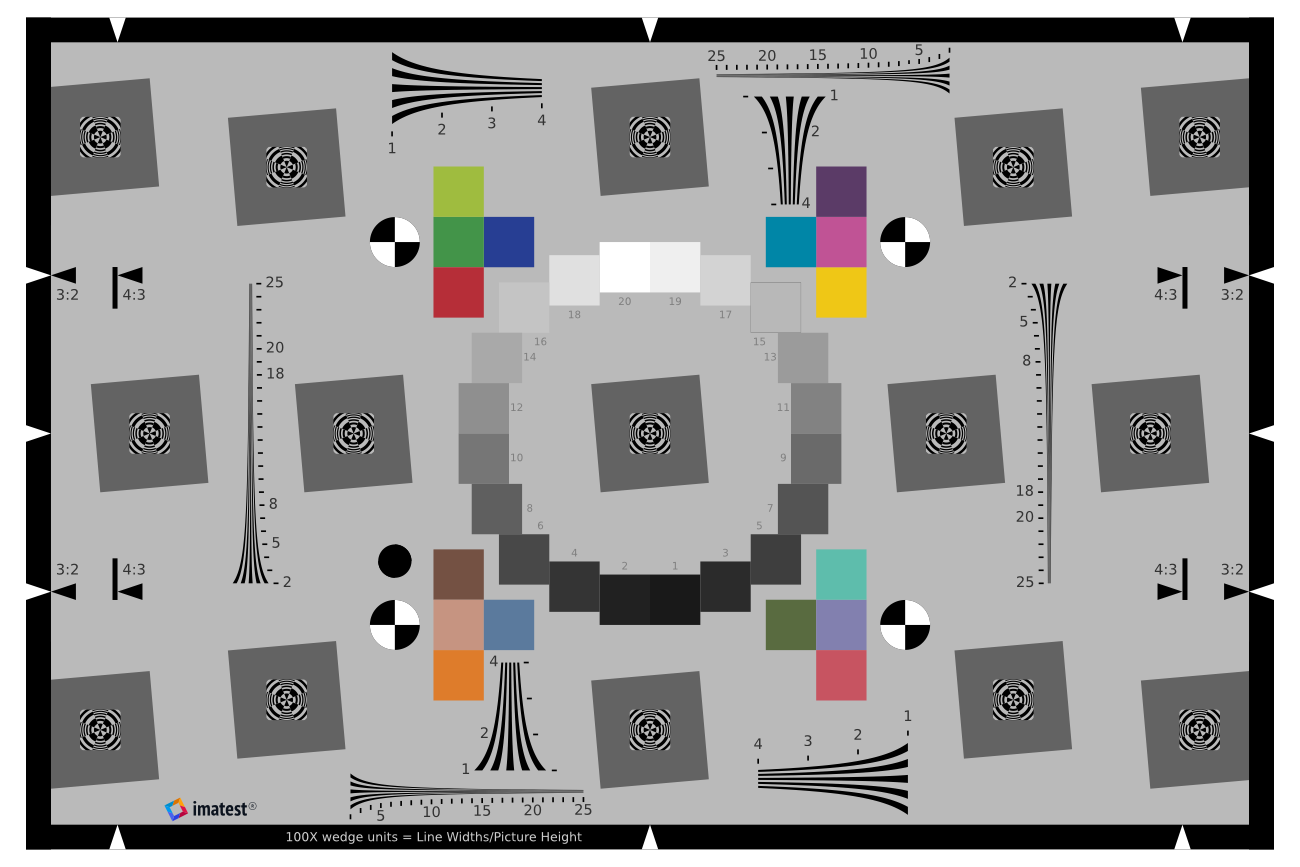
Imatest eSFR ISO 12233:2017
Fully compliant with ISO 12233:2017, this multi-feature chart design allows for the measurement of several key image quality factors.
Size Options:
2x Inkjet – Suitable for sensor resolution < 6MP
4x Inkjet – Suitable for sensor resolution < 24MP
Lighting Options:
KinoFlo Freestyle 31 LED:
- CCT: 2700-6500 K
- Intensity: 150:1 range, up to ~7000 lux at 0.5m
Thouslite 14-Channel LEDCube:
- SPD Matching Capability: 380-730nm
- CCT: 2000-20000 K
- Intensity: Varies by number of channels used
Capture/Analysis Options:
Processed
Raw
Key Metrics
Sharpness
Expressed as Spatial Frequency Response (SFR) or Modulation Transfer Function (MTF), measured from slanted square edges.
Chromatic Aberration
Lens aberration that causes colors to focus at different distances from the image center, measured from tangential edges near image sides or corners.
Tonal Response
The relationship between exposure and pixel level, measured from the grayscale patches surrounding the center of the chart.
Color Accuracy
CIELAB color differences, measured from color patches.
Aliasing
Signal energy above the Nyquist frequency, measured from the four pairs of wedges.
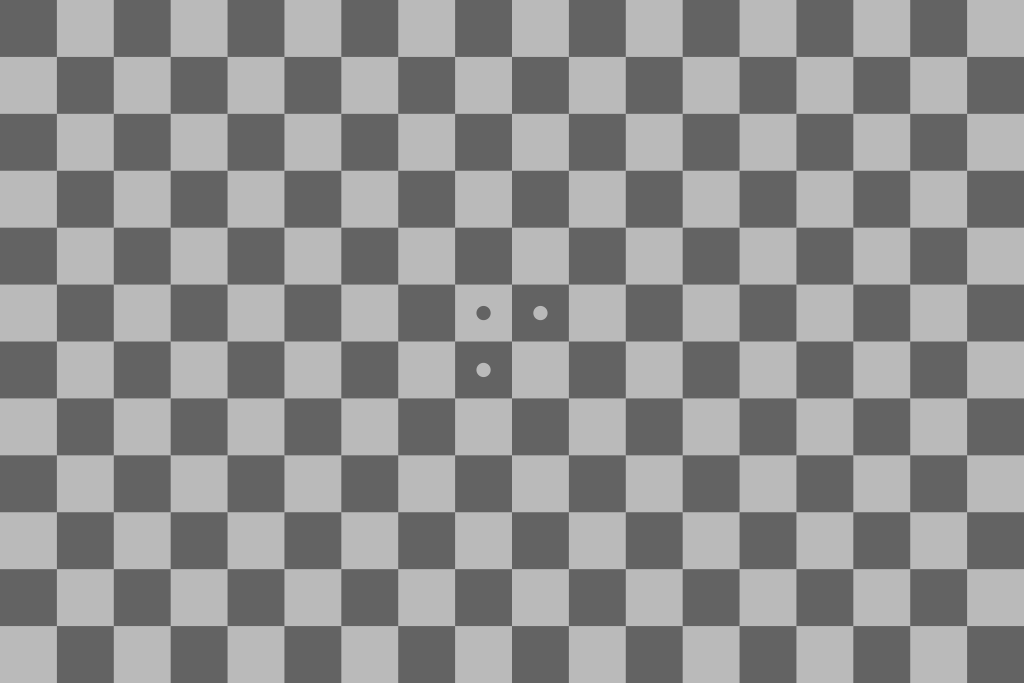
Imatest Checkerboard
Recommended chart for measuring distortion. Works over a wide range of testing distances for high-accuracy distortion characterization of your system.
Size Options:
Medium Inkjet – Suitable for sensor resolution < 14MP
Large Inkjet – Suitable for sensor resolution < 28MP
Lighting Options:
KinoFlo Freestyle 31 LED:
- CCT: 2700-6500 K
- Intensity: 150:1 range, up to ~7000 lux at 0.5m
Thouslite 14-Channel LEDCube:
- SPD Matching Capability: 380-730nm
- CCT: 2000-20000 K
- Intensity: Varies by number of channels used
Capture/Analysis Options:
Processed
Raw
Key Metrics
Distortion
Aberration that causes straight lines to curve near the edges of images. Distortion coefficients measured from checkerboard array using various distortion models.
Field of View (FoV)
Calculated by applying the distortion model equation to the top, side, and diagonal of the image.
Sharpness
Expressed as Spatial Frequency Response (SFR) or Modulation Transfer Function (MTF), measured from checker square edges.
Chromatic Aberration
Lens aberration that causes colors to focus at different distances from the image center, measured from tangential edges near image sides or corners.
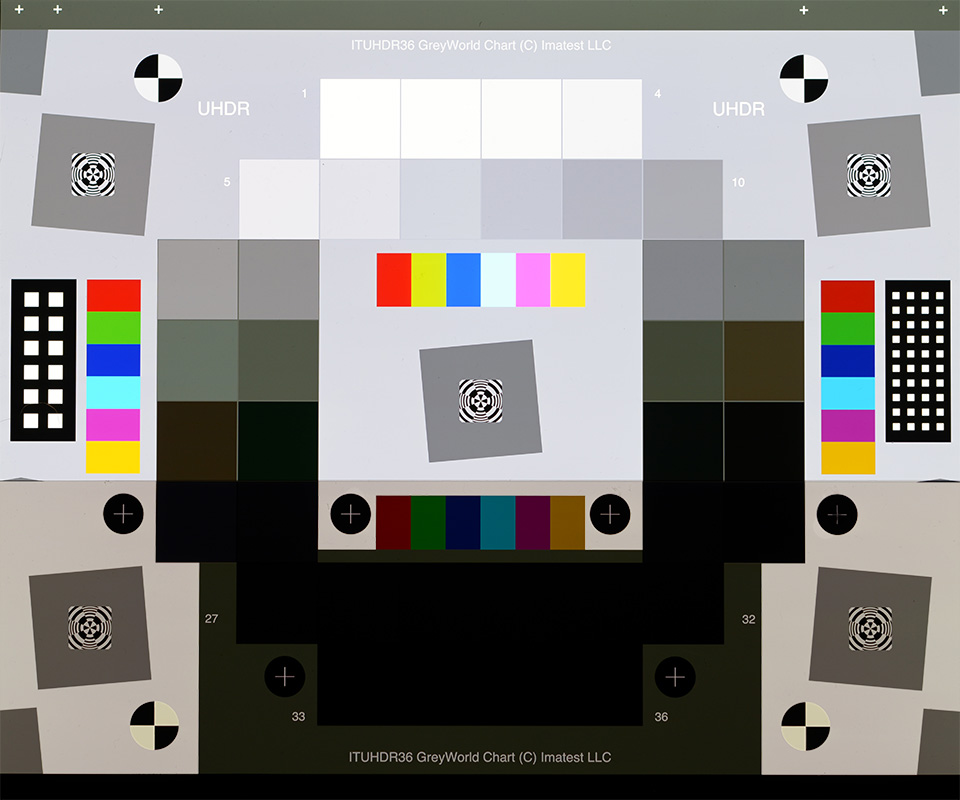
Imatest Dynamic Range
Paired with the dual-channel Imatest LED Lightbox (ILB-B-100K), this transmissive chart measures tonal response, noise, and dynamic range for custom and standard color temperatures.
Density Range Options:
Low – 50dB – Suitable for small pixel cameras
Wide – 100dB – Suitable for high-quality, non-HDR
Ultra-High – 150 dB – Suitable for HDR cameras
Lighting Options (ILB-B-100K):
Imatest Dual-Channel LED Lightbox (ILB-B-100K)
- CCT: 3100-6500 K
- Intensity: 30~100,000 lux
Capture/Analysis Options:
Processed
Raw
Key Metrics
Dynamic Range
The range of exposure over which a camera responds with good contrast and good Signal-to-Noise Ratio (SNR). Measured from grayscale patches.
Noise
Random variation of image density, visible as pixel level variations in digital images. Measured from grayscale patches.
Signal-to-Noise Ratio (SNR)
Noise with relationship to signal, measured from grayscale patches.
Tonal Response
The relationship between exposure and pixel level, measured from the grayscale patches.
Sharpness
Expressed as Spatial Frequency Response (SFR) or Modulation Transfer Function (MTF), measured from slanted square edges.
Imatest LED Lightbox
Produces a flat field with 95% uniformity and excellent spectral characteristics that can be adjusted over a wide range of brightness levels and color temperatures.
Size Options:
Size B – 260mm x 220mm
Lighting Options:
Imatest Dual-Channel LED Lightbox (ILB-B-100K)
- CCT: 3100-6500 K
- Intensity: 30~100,000 lux
Capture/Analysis Options:
Processed
Raw
Key Metrics
Uniformity
Nonuniformity caused by the lens, the sensor, or the lighting. Measured from images of a uniformly illuminated flat field.
Color Shading
Color variation over the image field from center to edge, described as the ratio or difference between RGB channels or LAB color differences.
Temporal Noise
Random noise that varies independently from image to image, measured by the difference of two uniform flat field images or from the average of multiple images.
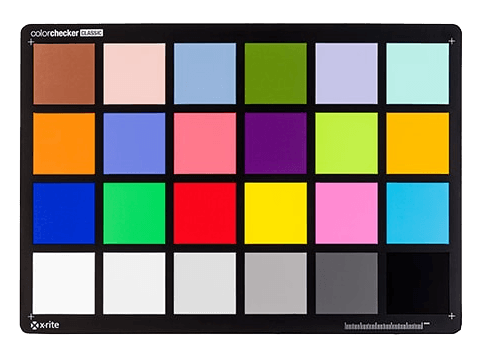
Calibrite ColorChecker
Calibrite ColorChecker targets are designed to compare digital reproductions to real life scenes or test targets to measure and analyze differences in color reproduction in any color rendition system.
Size Options:
Classic – 24 natural object, chromatic, primary and gray scale colors, arranged in four rows
Digital SG – 140 colors: 24 Classic patches, 17 step gray scale and 14 unique skin tone colors.
Lighting Options:
KinoFlo Freestyle 31 LED:
- CCT: 2700-6500 K
- Intensity: 150:1 range, up to ~7000 lux at 0.5m
Thouslite 14-Channel LEDCube:
- SPD Matching Capability: 380-730nm
- CCT: 2000-20000 K
- Intensity: Varies by number of channels used
Capture/Analysis Options:
Processed
Raw
Key Metrics
Color Accuracy
CIELAB color differences, measured from all color patches.
White Balance
Color deviation from neutral gray, measured from grayscale color patches.
Exposure Accuracy
Lightness deviation from reference value, measured from grayscale color patches.
Advanced Testing
Advanced data collection and analyses to produce a full suite of results based on major image quality standards and Imatest recommendations.
You get all of the data, a detailed report of key metrics, and for applicable tests—Imatest software plots and results files (JSON/CSV),
and the INI settings used to generate your results.
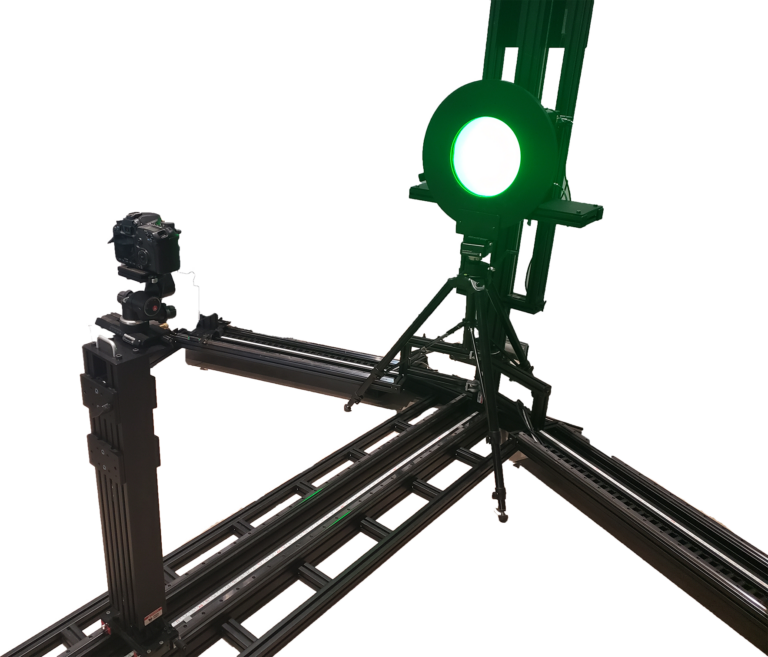
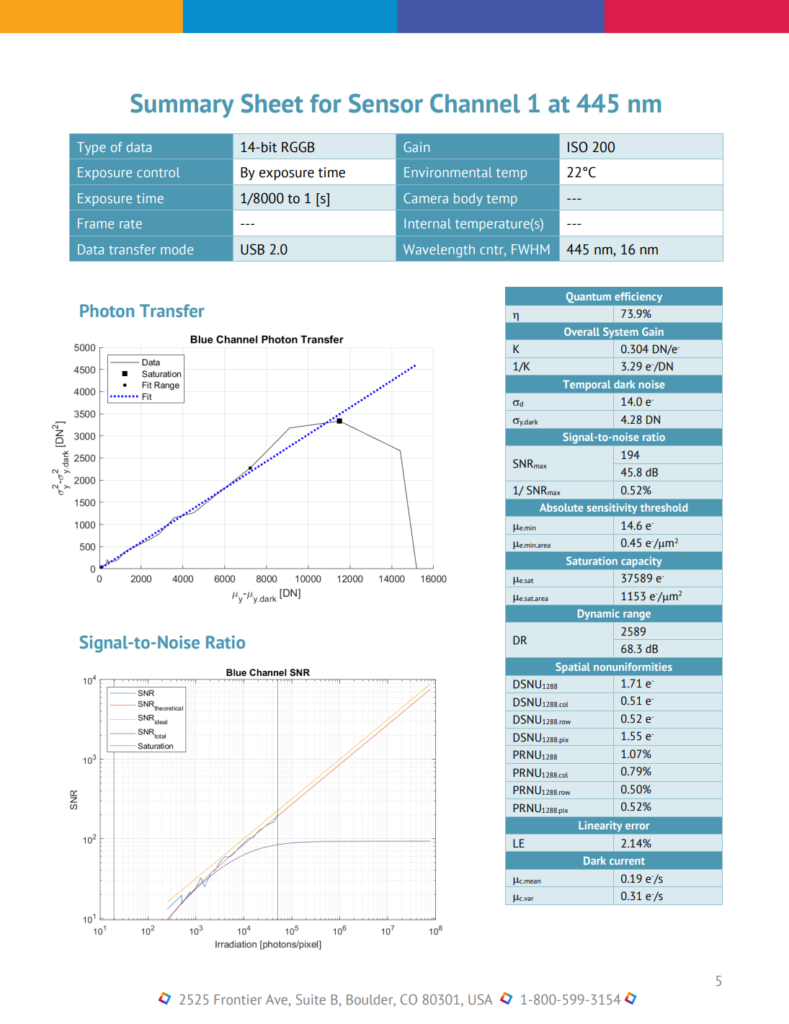
EMVA 1288 4.0 Sensor Characterization
The EMVA 1288 standard uses narrow-band light of known spectral properties to characterize individual channels of image sensors. Our lab services can measure the full suite of EMVA 1288 4.0 metrics for both linear and non-linear raw sensor data.
Lighting Options:
Thouslite 14-Channel LEDCube:
- SPD Matching Capability: 380-730nm
- 11 narrow-band channels
- Intensity: Varies by channel
Capture/Analysis Options:
Linear Raw (monochrome, RGB)
Non-linear Raw (monochrome, RGB)
Device Requirements:
- Device must have a removeable lens OR have a lens f/# of 8*
- Raw output must be standard format OR appropriate read functions must be supplied
- Device must have manual exposure control
- Peak response of individual device channels must correspond with available narrow-band light source channels
Relevant Standards:
* Testing without a lens is preferred and provides most accurate results. For testing with a lens, an f/# of 8 is required by the standard, but other lenses can be tested by applying an f/# correction.
Key Metrics
Quantum Efficiency
How effectively the sensor converts incident photons into electrons. Derived from images captured across multiple exposures.
Signal-to-Noise Ratio (SNR)
Noise with relationship to signal. Derived from variable-exposure light and dark images.
System Gain
Slope of the relationship between mean signal and variance (Photon Transfer Curve), derived from variable-exposure images.
Dynamic Range
Ratio between saturation capacity and absolute sensitivity threshold, derived from variable-exposure images.
Dark Current
Relationship between exposure time and signal generated by thermally induced electrons, derived from a series of dark images at multiple exposure times.
Spatial Nonuniformity
Total, column, row, and pixel spatial variances, derived from a large number of dark and light images.
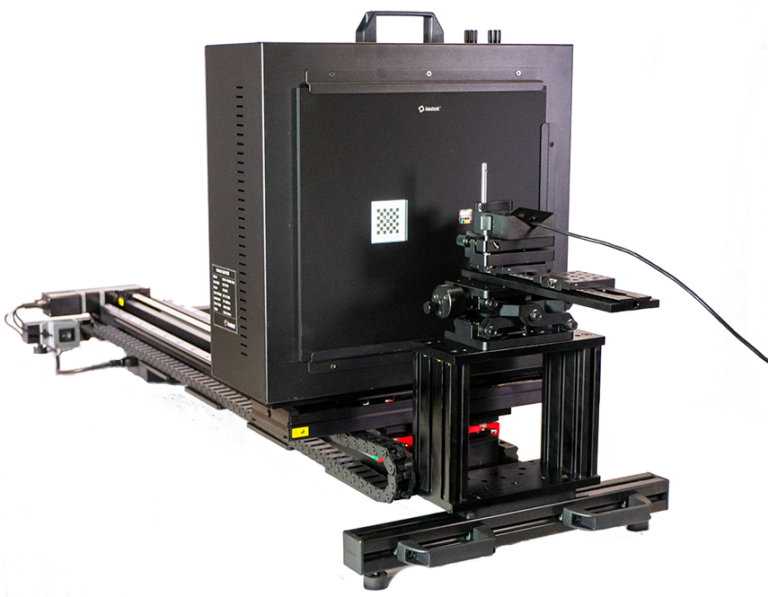
Endoscopic and Medical Device Testing
Our Benchtop Test Stand is well equipped to test endoscopes and medical devices for sharpness, color accuracy, and ISO 8600 metrics. Choose from a variety of micro targets designed specifically for endoscope and small sensor testing, and customize your lighting options for integrated or non-integrated illumination devices.
Target Options:
Reflective Targets (Good for testing integrated illumination):
- ISO 8600-3 Method A FOV Chart – ISO 8600 field of view
- ColorGauge Nano – Color accuracy
- Checkerboard Multi-Size Test Chart – ISO 8600 MTF, distortion
- 18% Gray Target – Uniformity
Transmissive Targets (Good for testing sensor/lens characteristics):
- Checkerboard Chrome on Glass Target – ISO 8600 MTF, distortion
- Imatest Lightbox Flatfield – Uniformity
Lighting Options:
Integrated illumination source (reflective):
- For devices with on-board illumination
- Illumination settings are device-dependent
Imatest Dual-Channel LED Lightbox (transmissive)
- CCT: 3100-6500 K
- Intensity: 30~100,000 lux
Aputure Light Storm LS 1c LED
- CCT: 3200-5500 K
- Intensity: up to ~25,000 lux at 0.5m
Capture/Analysis Options:
Processed
Raw
Relevant Standards:
Key Metrics
Field of View (FOV)
Angular range of observable area, in degrees, measured with ISO 8600-3 Method A FOV Chart.
MTF and Sharpness
Expressed as Spatial Frequency Response (SFR) or Modulation Transfer Function (MTF), measured from checkerboard square edges.
Distortion
Aberration that causes straight lines to curve near the edges of images. Distortion coefficients measured from checkerboard array using various distortion models.
Color Accuracy
CIELAB color differences, measured from ColorGauge Nano color patches.
Uniformity
Nonuniformity caused by the lens, the sensor, or the lighting. Measured from images of a uniformly illuminated flat field.
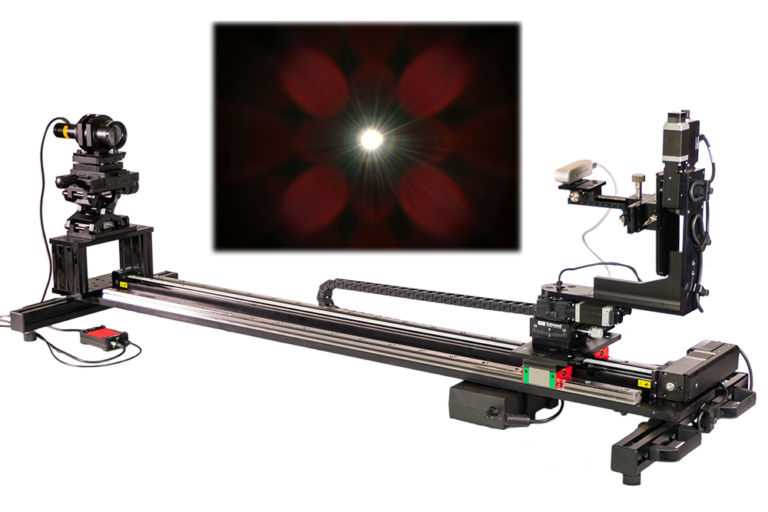
Imatest Stray Light Analysis
Imatest has dedicated equipment and space for characterizing the stray light (flare) in digital cameras. Our testing involves illuminating the camera device with a collimated point-like light source. Images are captured at different angles with the source positioned in and outside of the camera’s field of view. The captured images provide a detailed view of the stray light in the camera and can be further processed into “metric images” using Imatest software. Our test procedures and metrics are in line with developing standards (IEEE P2020, ISO 18844-2). See our documentation for more info.
Lighting Options:
Imatest Stray Light LED Source
- Visible (white LED)
- NIR 850nm (coming soon)
- NIR 940nm (coming soon)
- Front of camera device (lens) must have diameter less than or equal to 30 mm
- Device must have adjustable exposure / integration time
- Device must have ability to operate in linear (or raw) mode*
- Device must have ability to perform programmatic image capture **
Relevant Standards:
* Stray light testing with processed, nonlinear images is also available, but may not provide objective measurements as they assume that the image data are linear.
** Device must either be compatible with Imatest Image Acquisition Library, or an image capture routine must be provided in the form of a standalone executable or as a script
Key Metrics
Per Pixel Normalized Flare / Stray Light
Imatest’s recommended metric for evaluating the magnitude of stray light in an image, defined in IEEE P2020. Measures the response from stray light in the image relative to the response from the direct image of the on-axis source. Based on heritage methods/metrics used in the aerospace industry, i.e., point source rejection ratio and extended source rejection ratio.
Per Pixel Flare Intensity
Alternative metric for evaluating the magnitude of stray light in an image, defined in IEEE P2020. Measures the response from stray light in the image relative to the computed response from the on-axis source using an image of the source through a Lambertian diffuser.
Summary Statistics
We provide the full set of metric images and the data used to compute them. Supplemental results include plots of various summary metrics, as well as stats stored in standard output files (CSV, JSON, and/or HDF5). For example, we can plot minimum, mean, and maximum stray light in each image as a function light source field angle, the percentage of pixels in the image above a given threshold, and histograms of the metric image data.
Customized Testing & Consulting
Fully customizable lighting, charts, setup, and device settings. We’ll help you choose the best metrics and testing setup for your application and compile them into a custom Imatest Test Lab Services report.
Need a different testing solution?
We’ve got you covered. If you need a unique solution for testing your application beyond our pre-defined tests, we can create a custom test plan and report tailored to your needs.
Some examples of customized testing can include:
- Alternative and custom test chart configurations
- Advanced device settings
- Advanced lighting
- Benchmarking
- Custom hardware
- Metric development
- Video testing
Need an expert interpretation of results?
If you’re new to testing or unfamiliar with image quality metrics, we’re here to help. Supplement your report with an expert analysis of your results, with specific interpretation of output metrics for your particular device and application.
See some examples of our customized reports:
Interested in our test lab services?
Trust the experts in image quality. Contact us today at labservices@imatest.com or fill out the below form and one of our representatives will get in touch with you shortly.