Gamutvision main page – Gamutvision Table of Contents/Site map – Using Gamutvision – Using Gamutvision 2: Displays
Introduction – Bad profile example
Introduction
Gamutvision can analyze the performance of printer/paper/ICC profile combinations from ICC profiles themselves: you don’t need to have the printer or paper in your possession. All you need is the ICC profile, which can often be downloaded from the internet. With the profile and Gamutvision you to do a number of remarkable things.
- Find out about what performance to expect from a printer/paper combination before you buy.
- Determine the quality of ICC profiles and learn which rendering intents work best.
- Find out if your printer is performing as specified— by comparing test prints with Gamutvision simulations. Gamutvision won’t tell you why your prints don’t look right or whether it’s your printer hardware or software settings, but it will enable you to make a visual comparison, which can be a huge help in tracing problems.
Bad profile example
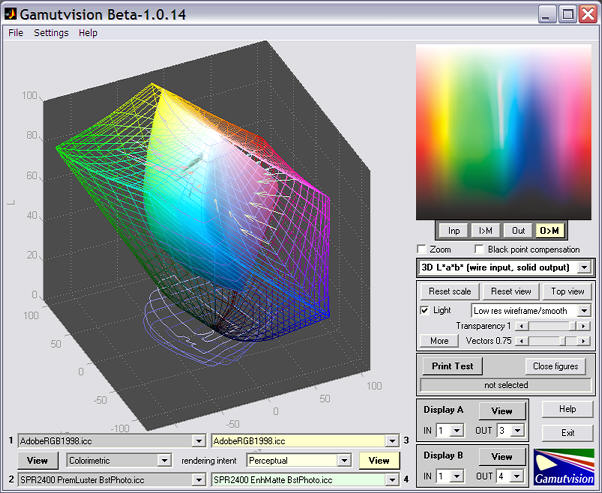
Once in a while you may stumble on a defective ICC profile. Because profiles have improved since this page was first written in 2006, you’re much less likely to find a bad one today., but it’s still possible. Epson’s standard profiles for their Ultrachrome and Ultrachrome K3 printers were generally excellent, but the SPR2400 EnhMatte BstPhoto.icc profile for the Epson R2400 printer with Enhanced Matte paper, set for the best quality print, had a defect when used with Perceptual rendering intent (frequently recommended for full-tone photographic images). The problem pops right out at you when you run Gamutvision, using the ICC profile as input.
The white band in the bright green-cyan region is out of place! There is a corresponding pothole in the 3D La*b* gamut plot. It’s not a common color; you wouldn’t notice the problem in most prints, but it might show up unexpectedly as white blotches in images of turquoise jewelry or a tropical lagoon. You could spend hours and burn lots of paper trying to diagnose the problem.
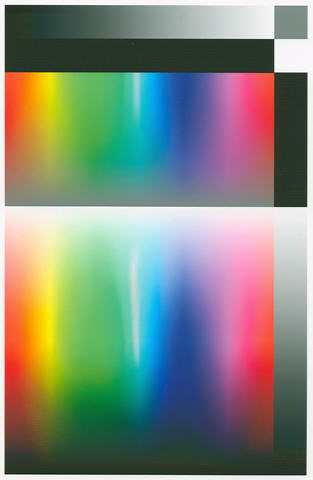
The simulation were verified by making a print.
|
A pattern with a wide range of HSL Hues, Saturations, and Lightnesses (from the now-deprecated pattern from Print Test* module) was printed with the Epson R2400 (6.5x10 inches) printer on Epson Enhanced Matte paper using the SPR2400 EnhMatte BstPhoto.icc profile with perceptual rendering intent. Results for the print scanned with the Epson 3200 flatbed scanner and saved as an sRGB file are shown on the right. The similarity of the scanned print with the image above— derived from the profile— is quite stunning; nearly perfect to the eye. |
|
|
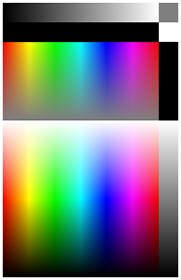
The original pattern is shown on the right, greatly reduced in size.
*Print Test was deprecated because it was difficult and tedious to use, requiring that the image be printed and scanned before it could be analyzed — and ultimately because it gave the same results as Gamutvision. |
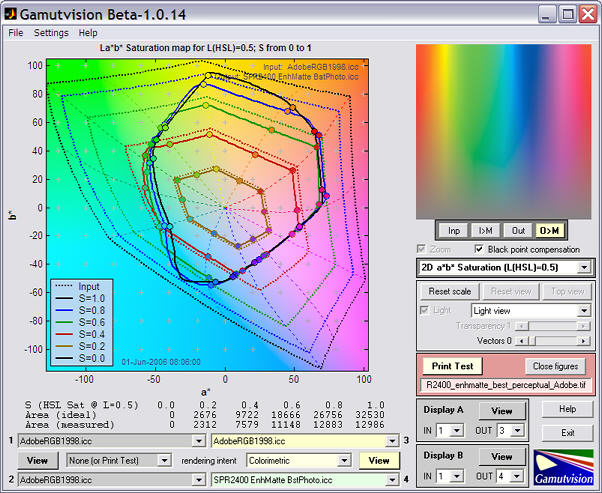
Here are the results of analyzing the scanned print using the now-deprecated Print Test feature. Results are similar to the Gamutvision image
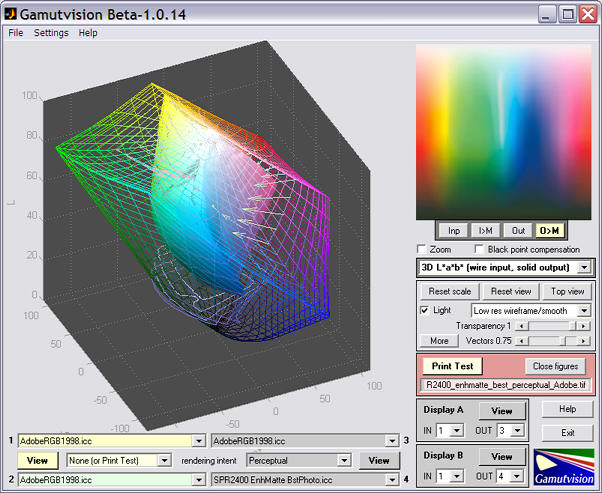 Though this closely resembles the above image,
it is derived from a scanned print rather than the ICC profile.
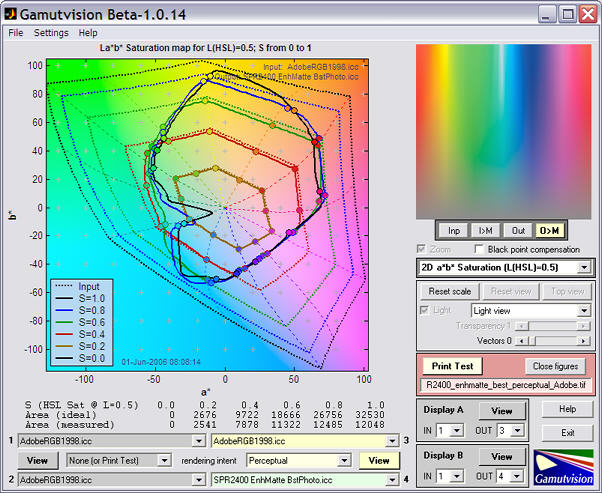
The results are nearly identical to the first image. The print was scanned on an Epson 3200 flatbed scanner set for ICM color management with output to Adobe RGB (1998). (This differs slightly from the image shown above, which was scanned to the sRGB color space for proper web viewing.) The comparison is even more impressive when we view the 2D La*b* saturation mapa.
|
Simulated
|
 |
|
Scanned
(analyzed now-deprecated
Print Test) |
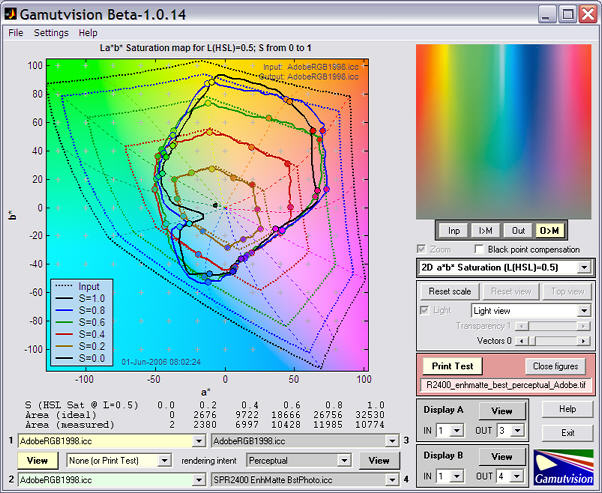 |
Of course the curves aren’t identical, but they’re remarkably close. It’s impressive when you consider that the the Epson 3200 is a relatively inexpensive consumer-grads scanner, not a laboratory instrument.
This profile is usable as long as you don’t use the perceptual rendering intent. The Relative Colorimetric intent works fine. Results are shown below.


