Gamma is the exponent of the equation that relates scene luminance with image pixel level.
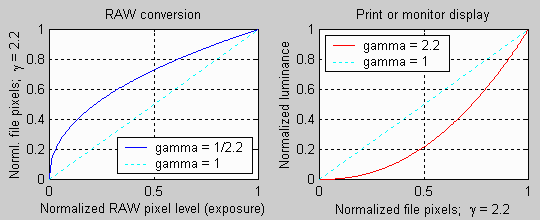
When the raw output of the image sensor, which is linear, is converted to image file pixels for a standard color space, the equation below is applied (very approximately, as we’ll explain below).
pixel level = (RAW pixel level)gamma_camera ~= exposuregamma_camera (1)
When an image file is sent to a display (a monitor or print),
Output luminance = (pixel level)gamma_display (2)
The total system gamma is gamma_camera * gamma_display. Standard values of display gamma are 1.8 for older color spaces used in the Macintosh and 2.2 for color spaces used in Windows, such as sRGB (the default) and Adobe RGB (1998).

Gamma, displayed linearly
Left: scene to file; Right File to display
|
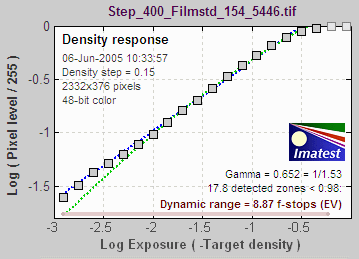
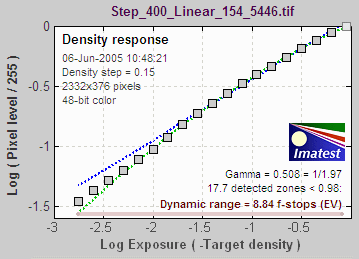
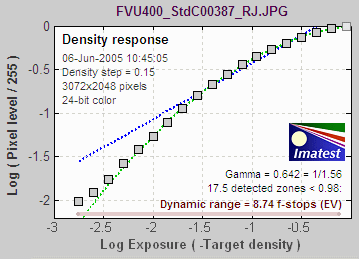
The three curves on the right, produced by Stepchart for the Canon EOS-10D, show how Gamma varies with RAW converter settings. In characteristic curves for film and paper, which use logarithmic scales (e.g., density (–log10(absorbed light) vs. log10(exposure)), gamma is the average slope of the transfer curve (excluding the “toe” and “shoulder” regions near the ends of the curve), i.e., Gamma is contrast.
See Kodak’s definition in Sensitometric and Image-Structure Data. To obtain the correct MTF, Imatest must linearize the pixel levels— the camera’s gamma encoding must be removed. That is the purpose of Gamma in the SFR input dialog box, which defaults to 0.5, typical for digital cameras. It can, however, vary considerably with camera and RAW converter settings, most notably contrast. Characteristic curves for the Canon EOS-10D with three RAW converter settings are shown on the right. Gamma deviates considerably from 0.5. Gamma = 0.679 could result in a 9% MTF50 error. For best accuracy we recommend measuring gamma using Colorcheck or Stepchart, which provides slightly more detailed results. Confusion factor: Digital cameras rarely apply an exact gamma curve: A “tone reproduction curve” (an “S” curve) is often superposed on the gamma curve to extend dynamic range while maintaining visual contrast. This reduces contrast in highlights and (sometimes) deep shadows while maintaining or boosting it in middle tones. You can see it in curves 1 and 3, on the right. For this reason, “Linear response” (where no S-curves is applied on top of the gamma curve) is recommended for SFR measurements. The transfer function may also be adaptive: camera gamma may be higher for low contrast scenes than for contrasty scenes. This can cause headaches with SFR measurements. But it’s not a bad idea generally; it’s quite similar to the development adjustments (N-1, N, N+1, etc.) in Ansel Adams’ zone system. For this reason it’s not a bad idea to place a Q-13 or Q-14 chart near the slanted edges. To learn more about gamma, read Tonal quality and dynamic range in digital cameras and Monitor calibration. |
3. Canon FVU set to Standard contrast. |


 1. Capture One LE set to Film standard
