Introduction: Intro to stray light testing and normalized stray light | Outputs from Imatest stray light analysis | History Background: Examples of stray light | Root Causes | Test overview | Test factors | Test Considerations | Glossary Calculations: Metric image | Normalization methods | Light source mask methods | Summary Metrics | Analysis Channels | Saturation Instructions: High-level Imatest analysis instructions (Master and IT) | Computing normalized stray light with Imatest | Motorized Gimbal instructions Settings: Settings list and INI keys/values | Standards and Recommendations | Configuration file inputStray light (flare) documentation pages
Page Contents
This page provides an overview of the various outputs from the Imatest stray light source analysis.
- Overview of outputs from Imatest stray light analysis
- Normalized stray light metric images
- Stray light level plots
- Stray light pixel count plots
- Stray light metric image histograms
- Standard output files (JSON, CSV, HDF5)
- References
Overview of outputs from Imatest stray light analysis
-
-
Normalized (or unnormalized) stray light metric image FITS file(s) containing floating point metric image data. Each pixel in the input image(s) can be normalized to represent a metric. The main metric described in this page is normalized stray light, which involves normalizing by the image level of the direct image of the source. The stray light metric images are the primary output from the analysis.
-
Color-mapped stray light metric image plots
-
Per-image color-mapped stray light metric image plots (saved as image files). These plots provide an easy way to view the stray light metric images.
-
Movie files (GIF, AVI, MP4) that show an animation of the full set of color-mapped stray light metric image plots (Note: MP4 output is not available on the Linux OS)
-
-
Corresponding mask image FITS file(s) containing the binary mask image that was used to mask out the direct image of the light source in the associated stray light metric image.
-
Note: The stray light metric image data and mask image are also included in the HDF5 result file.
-
-
-
Stray light level plots: stray light metric image statistics (e.g., mean, max, 75th percentile, etc.) plotted as a function of image index or light source field angle.
-
Stray light pixel count plots: stray light metric image counts (number of pixels) plotted as a function of image index or light source field angle.
-
-
Stray light metric image histograms
-
-
Per-image stray light metric image histograms (saved as image files). These histograms represent the distribution of data from the stray light metric images.
-
Movie files (GIF, AVI, MP4) that show an animation of the full set of stray light metric image histograms (Note: MP4 output is not available on the Linux OS).
-
-
-
Standard output files (JSON, CSV, HDF5)
-
JSON-encoded text file containing structured stray light analysis inputs and results including per-image stats and summary / multi-image stats (values equivalent to CSV).
-
CSV file containing tabulated stray light analysis inputs and results including per-image stats and summary / multi-image stats (values equivalent to JSON).
-
HDF5 file containing structured stray light analysis input and results (values equivalent to JSON and CSV), as well as the full set of input image data, output stray light metric image data, and binary mask image data.
-
-
- FITS file(s) containing the light source mask produced for the image.
Normalized stray light metric images
The primary output from the stray light analysis are stray light metric images.
The stray light metric images can be output as FITS files and as color-mapped plots (saved as image files). The metric image FITS files contain the floating point metric image data which can be used for supplementary analysis. The color-mapped metric image plots provide an easy/convenient way to view the stray light metric images. Users can also access the metric image data within the structured HDF5 output file. For more detail on interpreting normalized stray light metric images, see also the stray light documentation landing page.
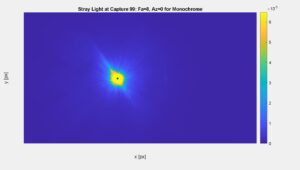
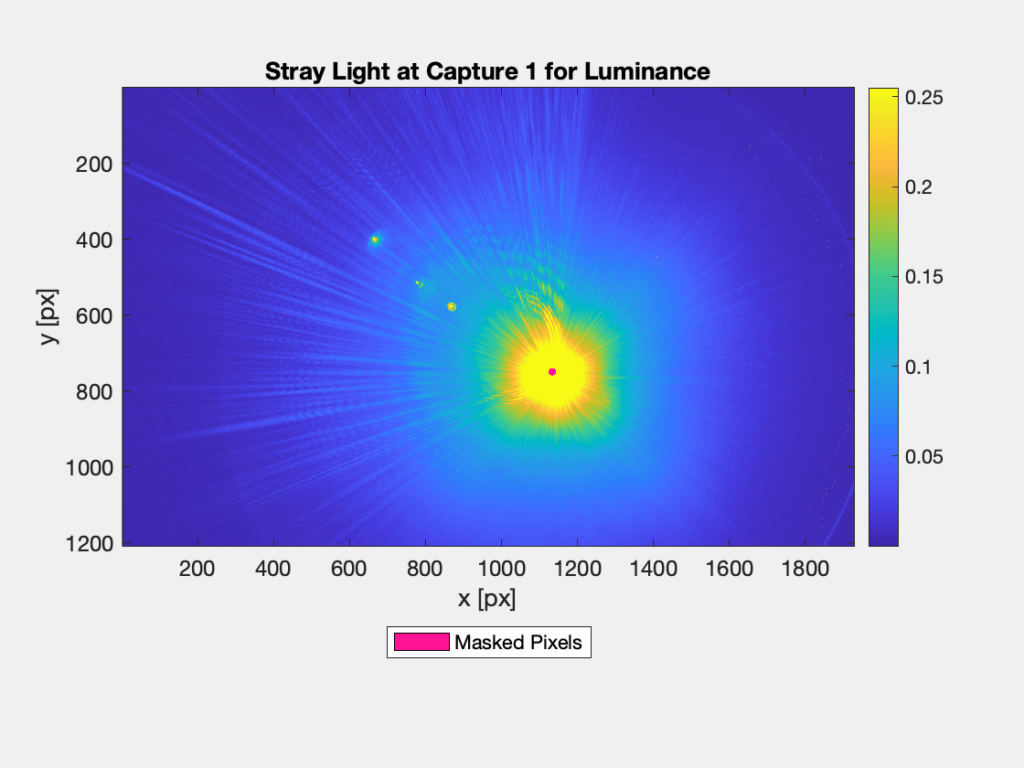
Figure 1: A color-mapped plot of a normalized stray light metric image. The linear image data has been normalized by the level (digital number / pixel value) of the direct image of the light source from a separate on-axis image. For the on-axis reference image, we used a shorter exposure time and attenuated the light source with a neutral density filter such that the direct image of the source was not saturated. We computed the mean level from within the direct image of the source in the reference image. We then compensated for the difference in light level between the reference image and test image to compute a theoretical level above saturation as the final “compensated” normalization factor. Here, the level of stray light in the metric image is measured to be around 0.0006% or less of the level from the direct image of the source, although the saturated stray light (yellow) is likely greater in magnitude. The light source in use has an angular diameter of about 0.5 degrees (similar to the Sun) and the computed metric is Extended Source Rejection Ratio (ESRR) [2]. The direct image of the source is masked out because it is not stray light.
Figure 2: Masked pixels in color-mapped metric images are indicated in pink.
Stray light metric image FITS files
Flexible Image Transport System (FITS) is a file format designed for storing and manipulating scientific image data.
Users have the option to output stray light metric image FITS files from the Imatest stray light analysis.
The metric image FITS files contain floating point data with values corresponding to the calculated stray light metric for each pixel in the image. Note that if the light source is masked out, those values will be NaN (not a number). Users who want to make the most out of their stray light metric images can use the FITS file output to perform supplemental stray light analysis. For example, the metric image FITS files can be read into the user’s programming language of choice for further data processing, or into one of many existing FITS viewer applications. The FITS file format is commonly used within the astronomy community and many software tools/applications already exist for analyzing FITS file image data. These tools can be used to visually tease out information from the stray light metric images, for example, by manipulating the color and scaling of the image data.
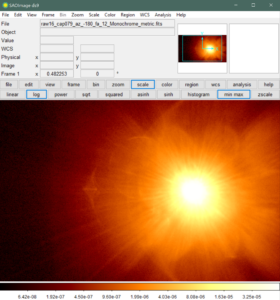
Figure 3: A screenshot of the SAOImageDS9 application. A stray light metric image FITS file has been manipulated using DS9 with logarithmic scaling and the “bb” colormap to better reveal certain stray light artifacts.
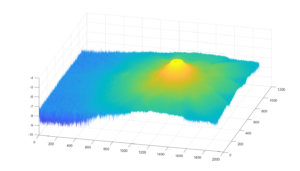
Figure 4: A 3D surface plot produced using a FITS file that has been read into MATLAB and plotted with logarithmic scaling. FITS files can be read into MATLAB using the fitsread() command and plotted as a surface plot using the surf() command. In this case, the command was surf(log10(im), 'EdgeColor', 'None'); where im is the image array read from the fitread() command.
Binary mask FITS files
Users have the option to output a FITS file containing the generated binary mask of the light source for each metric image. The binary mask FITS file is a uint8-encoded image where 1 represents the masked pixels and 0 represents the unmasked pixels.
Color-mapped stray light metric image plots
Users have the option to output color-mapped stray light metric image plots (saved as image files) from the Imatest stray light analysis, representing the primary result of each individual input image under test. Users can also output the same plots as a movie (GIF, AVI, MP4) to show an animation of the full set of metric image plots. Note: MP4 output is not available on the Linux OS.
The color-mapped stray light metric image plots provide a quick and easy way to assess stray light, especially when viewed as a movie. Users who want to further inspect their stray light metric images can do so by looking into the associated metric image data (from the corresponding FITS file or HDF5 output) and/or by making use of the abundance of other derived output statistics (e.g., from the JSON output or from other plots).
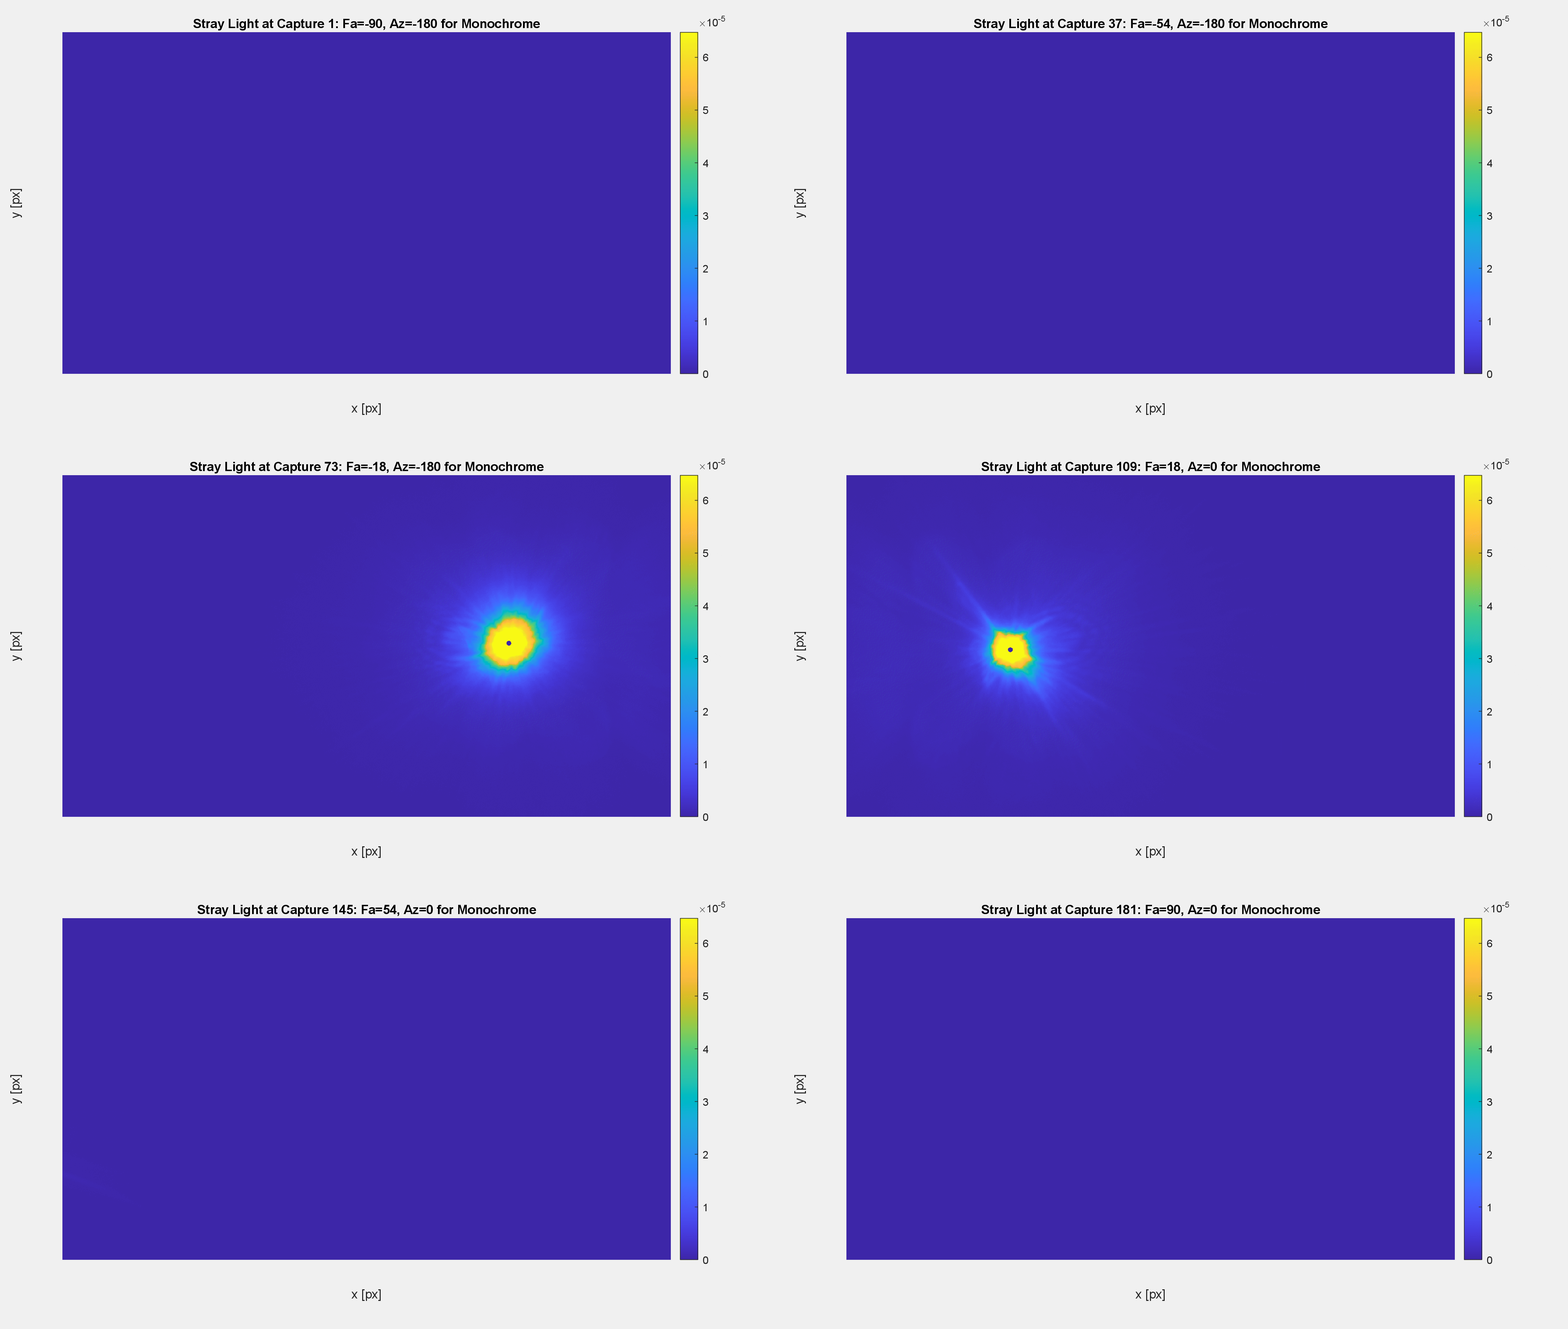
Figure 5: A GIF generated by Imatest showing a series of normalized stray light metric images (color-mapped plots). The data show a 180-degree horizontal sweep of the light source field angle (Fa) across the camera’s horizontal full FOV (which is around 70 degrees), including angles well outside the FOV.
Stray Light Level Plots
Users have the option to output “stray light level plots” (saved as image files) from the Imatest stray light analysis.
The stray light level plots show various statistics (chosen by the user), derived from the metric image data, and plotted as a function of the capture index or light source field angle. These could include statistics including the mean or max of each metric image and/or different percentiles of the metric image data e.g., 75th and 95th percentile. These high-level statistics can potentially be used as pass-fail criteria and, when plotted as a function of light source field angle, they can provide a meaningful summary or high-level insight into the data. The plotted statistics are also included in the standard output files (JSON, CSV, HDF5) in a vectorized format for external plotting or supplemental analysis.
However, do note that derived summary metrics will never illustrate the whole picture, whereas the metric images themselves do. For example, one image may produce worse stray light summary metrics, but the stray light may be entirely manifested as veiling glare, while another image may produce better summary metrics, but the stray light is manifested as multiple distinct ghosts. Which stray light is worse? Additional subjective analysis of the metric images themselves may be required to understand if the stray light in those images is significant to the application of the camera system.
Note that stray light-level summary statistics can be influenced by saturation in the metric images in a way that can be misleading. For example, consider two separate sets of images of a stray light source. The first set of images were using a camera exposure time of 50ms, while the second set of images were using a camera exposure time of 200ms. The second set of images will show more stray light but also more saturation and blooming around the direct image of the source. These saturated regions of the image will push global statistics like mean towards the value that corresponds with saturation, but not above, so these stats may actually be lower than they should be (if we were able to measure the saturated stray light).
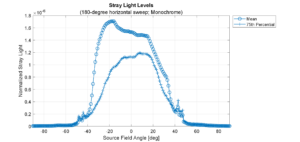
Figure 6: A stray light level plot showing the global mean and 75th percentile of the metric image data plotted as a function of light source field angle. Note that different summary metrics can tell different stories about the data and may even be misleading with respect to summarizing the data. Here, the mean of the metric image data shows higher levels on the left side of the field, while the 75th percentile shows higher levels on the right side of the field. There are also jumps around the edge of the camera’s field of view (). Note that here, negative field angles were used to describe the left side of the image field. The plotted data corresponds to the color-mapped metric image GIF above (Figure 5).
Stray Pixel Count Plots
Users have the option to output “stray light pixel count plots” (saved as image files) from the Imatest stray light analysis.
The stray light pixel count plots show the number of pixels corresponding to certain levels of stray light or features in the image. This includes the number of pixels above a chosen level threshold (e.g., the number of pixels greater than or equal to a stray light level of 0.002), as well as the total number of pixels in the image and the number of masked pixels. Similar to the level statistics, these pixel counts can potentially be used as pass-fail criteria and, when plotted as a function of light source field angle, they can provide a meaningful summary or high-level insight into the data. The stray light pixel count plots are related to the stray light histograms, in that they can be used to describe the distribution of the stray light data in the image. The plotted statistics are also included in the standard output files (JSON, CSV, HDF5) in a vectorized format for external plotting or supplemental analysis.
Note that pixel count stats/plots are less prone to error caused by saturation than level stats/plots. For example, while the global mean level of the metric image can be influenced by saturation (driving the mean lower than it would be if we could measure above saturation), the “number of stray light pixels greater than or equal to 0.002” will be the same regardless of whether or not there are saturated pixels in the metric image.
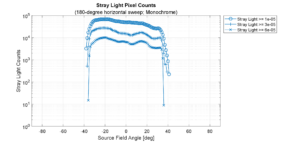
Figure 7: A stray light pixel count plot showing the number of pixels in the metric images (greater than or equal to three different level thresholds) plotted as a function of light source field angle. The Y-axis, which corresponds with the number of pixels, is logarithmically scaled to put each level threshold on a similar visual scale. Here, each level threshold shows greater numbers of stray light pixels (greater than the associated level thresholds) on the left side of the image field, with a slight jump on the mid-right field. Note that here, negative field angles were used to describe the left side of the image field. The plotted data corresponds to the color-mapped metric image GIF above (Figure 5).
Stray light metric image histograms
Users have the option to output stray light metric image histograms (saved as image files) from the Imatest stray light analysis, representing the distribution of the metric (e.g., PSRR) from the stray light metric image data. Users can also output the same histograms as a movie (GIF, AVI, MP4) to show an animation of the full set of metric image histograms. Note: MP4 output is not available on the Linux OS.
The metric image histograms can potentially provide meaningful high-level insight into the data. For example, by comparing individual histograms users may be able to identify which images or light source angles lead to unwanted distributions of stray light. The histograms can also be used to come up with good “level thresholds” which can be plotted on the Stray Light Pixel Count Plots.
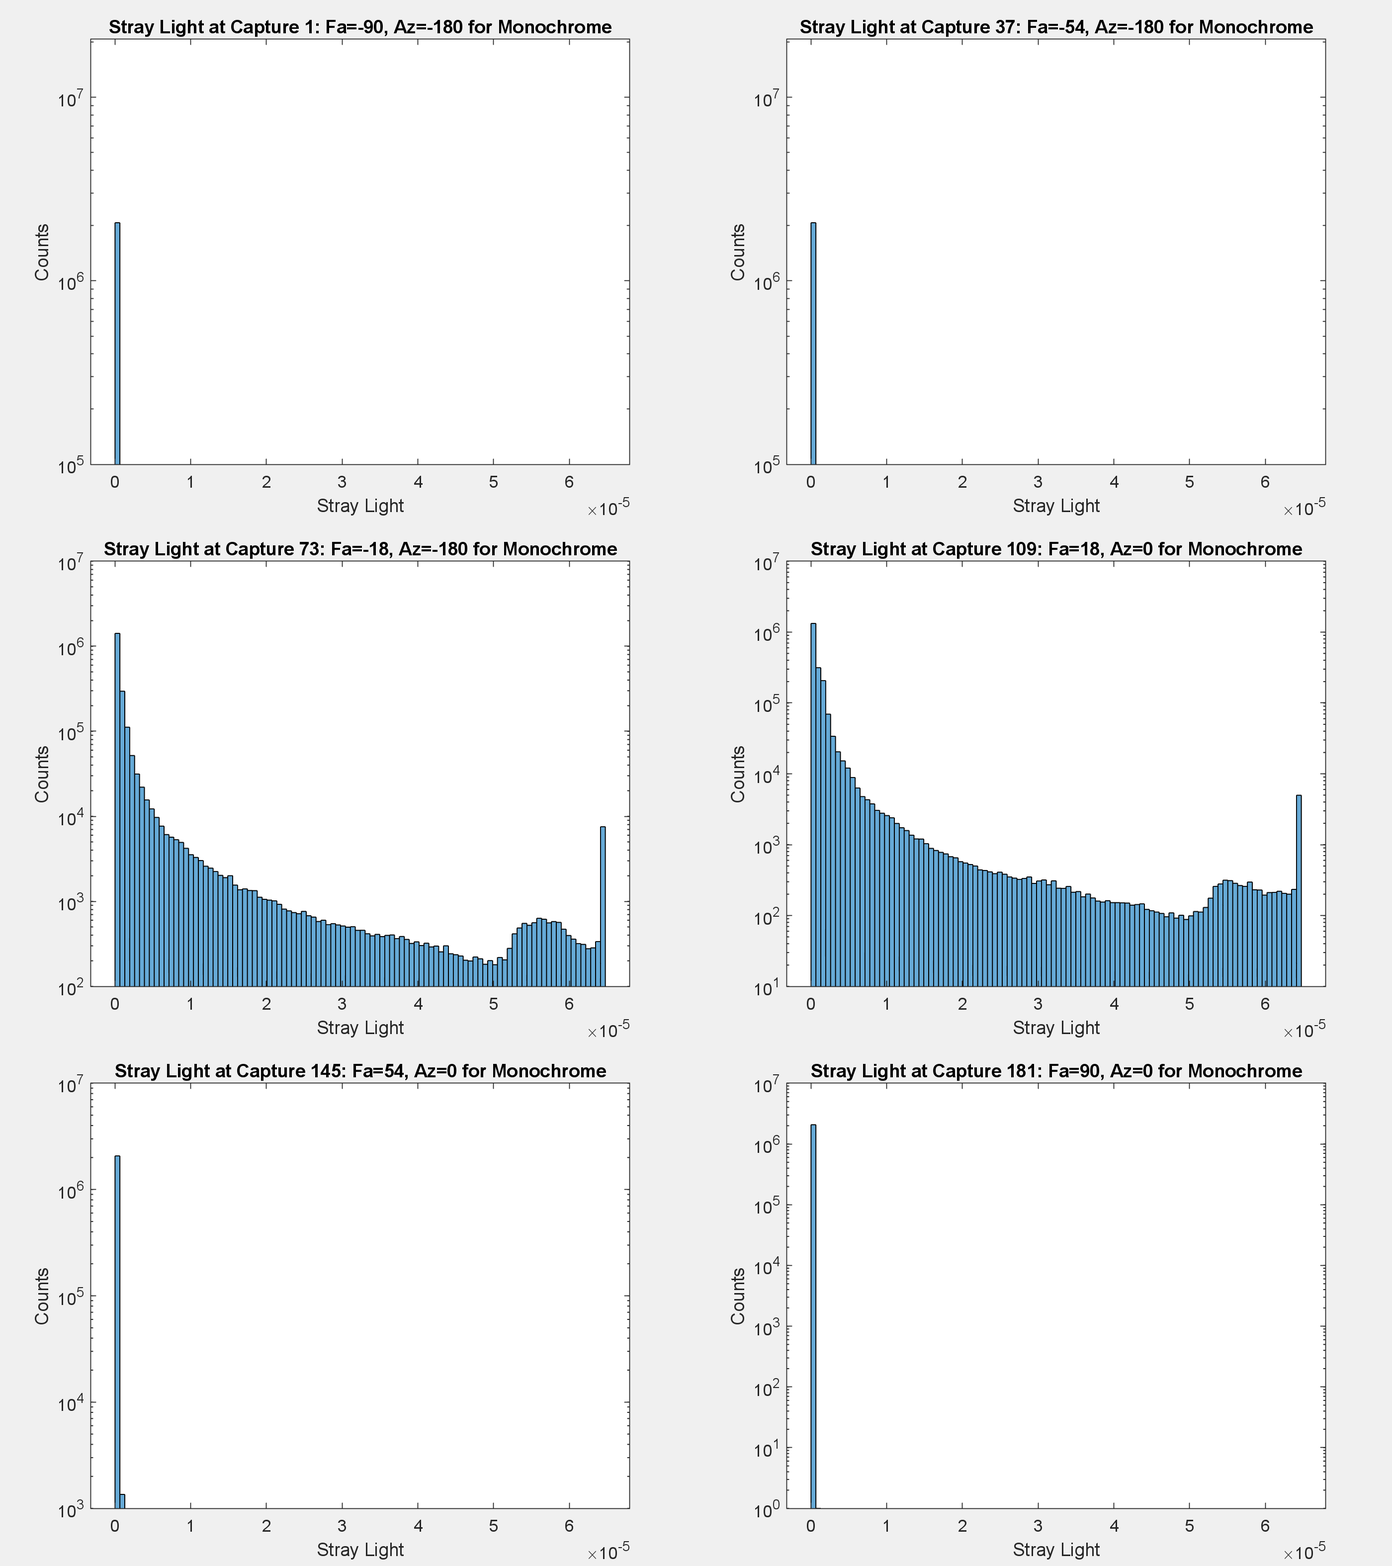
Figure 8: A GIF of a series of stray light metric image histograms, corresponding to 180 images. Each histogram frame shows the distribution of normalized stray light from the corresponding metric image data. The title shows the field angle (Fa) of the light source. The lowest levels of stray light appear when the light source was positioned at angles outside the camera’s FOV. The plotted data corresponds to the color-mapped metric image GIF above (Figure 5).
Standard output files (JSON, CSV, HDF5)
Users have the option to output several standard output files (JSON, CSV, HDF5) that contain structured stray light analysis inputs and results including per-image stats and summary / multi-image stats.
The HDF5 file (.h5) contains the full set of input image data, output metric image data, and binary mask image data in addition to the same outputs as the JSON and CSV. Hierarchical Data Format (HDF) is a set of file formats (including HDF5) for storing and organizing large amounts of data. For example, NASA uses the HDF format for their Earth observation mission data. Starting in Imatest 22.2, users can optionally access all of their stray light data within an HDF5 standard output file, for the purpose of external analysis and/or data distribution. HDF5 can be read using an external application or programmatically with most programming languages.
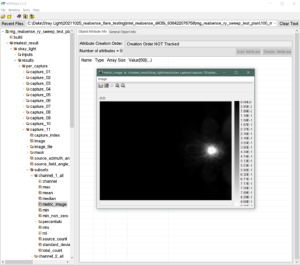
Figure 9: A screenshot of a free HDFView application. The stray light output structure can be navigated using the pane on the left. Here, a stray light metric image, accessible from within the output structure, is opened for viewing.
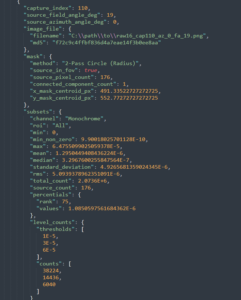
Figure 10: Screenshot of showing a snippet of the JSON standard output file from the Imatest stray light analysis. The snippet shows various stats, including those chosen by the user, for a given normalized stray light metric image channel.
References
[1] Jackson S. Knappen, “Comprehensive stray light (flare) testing: Lessons learned” in Electronic Imaging, 2023, pp 127-1 – 127-7, https://doi.org/10.2352/EI.2023.35.16.AVM-127


