Test plan reference: Slanted-edge modules

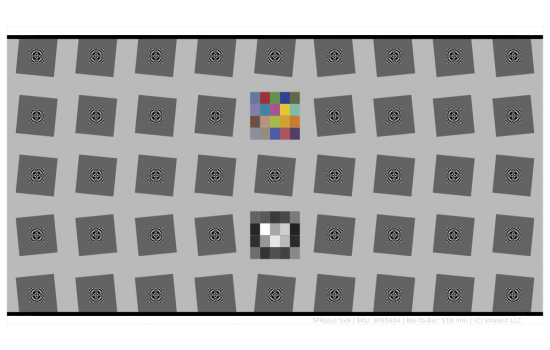
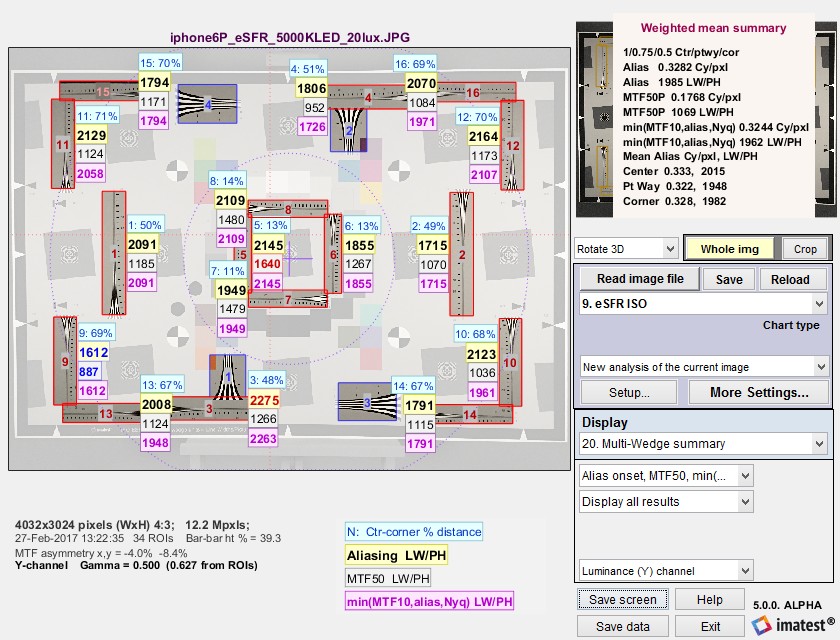
This document contains reference data intended to help Imatest users implement test plans that include automatically-detected slanted-edge modules. It describes the most important JSON results, which can be used for Pass/Fail criteria, as well as the key settings needed to get these results.Settings windows and recommended settings Settings for slanted-edge modules Slanted-edge modules can be run in either Setup (interactive) or Auto (batch-capable) mode. You can make settings in Setup mode; Auto mode uses saved settings from Setup mode.  When you run one of  the four auto-detection slanted-edge SFR modules (eSFR ISO, SFRplus, Checkerboard, and SFRreg) in Setup mode, the […]

Gamma, Tonal Response Curve, and related concepts

Introduction – Encoding vs. Display gamma – Why logarithms?  How gamma-encoding increases dynamic range – Expected gamma values –  Entering gamma into Imatest  Gamma and MTF – The effects of gamma errors on MTF  Which patches are used to calculate gamma? – Why gamma ≅ 2.2? – Why are raw-converted images often dark?  Tone mapping – Contrast definitions: Ratio, Weber, Michelson – Logarithmic color spaces – Monitor gamma  Introduction In this post we discuss a number of concepts related to tonal response and gamma that are scattered around the Imatest website, making them hard to find. We’re putting them together here in […]

Using images of noise to estimate image processing behavior for image quality evaluation

In the 2021 Electronic Imaging conference (held virtually) we presented a paper that introduced the concept of the noise image, based on the understanding that since noise varies over the image surface, noise itself forms an image, and hence can be measured anywhere, not just in flat patches. You can download the full paper (in the original PDF format) here.

Comparing sharpness in cameras with different pixel count

Introduction – Spatial frequency units – Summary metrics – Sharpening  Example – Summary Introduction: The question We frequently receive questions that go something like, “How can you compare the sharpness of images taken with different cameras that have different resolutions (total pixel count) and physical pixel size (pitch or spacing)?” The quick answer is that it depends on the application. Are you interested in the sharpness of the image over the whole sensor (typical of most pictorial photography— landscape, family, pets, etc.)? We call these applications image-centric. Do you need to measure details of specific objects (typical for medical imaging […]

SFRreg Charts for Imatest LED Light Sources

The SFRreg test charts are available Pre-Mounted for use with Imatest LED Light Sources. This chart consists of a slanted-edge quadrant pattern enclosed within a circle. It is used for measuring MTF and lateral chromatic aberration. A test image typically contains several targets that are automatically detected and analyzed by Imatest. Learn more about using SFRreg Patterns within Imatest.

Using direct image acquisition

Direct image acquisition allows images to be captured directly from a variety of devices without first being stored as files. It has several important applications. Introduction – Direct data reload for realtime analysis – Signal averaging By continuously reloading images, it can be used for realtime (or near-realtime) image analysis, where “realtime” means that analysis appears to be instant in the timeframe of human perception. It is especially valuable for focusing with slanted-edges (which can be analyzed faster than other MTF patterns) or with cropped areas of arbitrary images.   It is very useful for signal averaging — a technique […]

Wedge

Analysis of hyperbolic or trapezoidal wedge patterns with the Imatest Wedge and eSFR ISO modules News– 2021.1.  In Imatest 2020.2 calculations were greatly sped up in order to improve performance of direct image acquisition. During the testing of the speedup with direct acquisition, we found that Wedge results were unstable during repetitive acquisitions— that noise could cause significant variation from one image to the next. To make results more stable, we made a great many changes to the wedge calculation, most notably increasing smoothing in the bar count and MTF measurements.  As a result of these improvements, 2021.1 results are […]

Version Comparison: Studio vs. Master

Which version is right for you? Imatest 5.0:  All functions of Imatest Image Sensor have been incorporated into Imatest Master.   Imatest is available in several GUI (Graphic User Interface)-based versions. Studio, with everything individual photographers need to test their cameras and lenses. Studio is only available to individual photographers. Master, the full-featured industrial-strength version for engineers and scientists who develop and evaluate imaging systems. Acquire images directly from several manufacturer’s development systems. Images can be updated and analyzed in real time with the Rescharts, Multicharts, and Uniformity-Interactive modules. As of Imatest 5.0, Image Sensor (IS) has been discontinued. All […]

Using Test Charts

Create test charts for high quality inkjet printers Although we strongly recommend that customers purchase charts from the Imatest Store, the Imatest Test Charts module allows you to create test chart files for printing on high quality photographic inkjet printers. If you plan to print charts using this module, you should be skilled at fine printing and have a knowledge of color management to obtain optimum chart quality; otherwise we recommend purchasing charts at the Imatest Store. Disclaimer: Although we sell most of the charts generated by the Imatest Test Charts module, several variations are not available because (A) it’s […]

Using SFRreg Part I

Imatest SFRreg performs highly automated measurements of sharpness (expressed as Spatial Frequency Response (SFR), also known as Modulation Transfer Function (MTF)) and Lateral Chromatic Aberration from images that contain registration mark patterns (circles with two light and two dark quadrants). Unlike standard test charts, these patterns do not need to be located on a flat (planar) surface. Since Region of Interest (ROI) detection is automatic, they may be positioned where needed. Depending on the image source, they offer several advantages. You can Test images at infinity distance (or any distance of choice) using a compact projection system such as a collimator […]

Using SFRreg, Part 3: Results

Imatest SFRreg performs highly automated measurements of sharpness (expressed as Spatial Frequency Response (SFR), also known as Modulation Transfer Function (MTF)) and Lateral Chromatic Aberration from images that contain registration mark patterns (circles that contain two light and two dark quadrants). This document illustrates SFRreg results. Part 1 introduced SFRreg and explained how to obtain and photograph the chart. Part 2 showed how to run SFRreg inside Rescharts and how to save settings for automated runs.   SFRreg results When calculations are complete, results are displayed in the Rescharts window, which allows a number of displays to be selected. The following […]

Using SFRreg, Part 2: Running SFRreg

Running SFRreg (Interactive and Auto mode settings) Setup window – ROI numbering – More settings – SFRreg target detection Auto mode settings – Warnings – Summary Imatest SFRreg performs highly automated measurements of sharpness (expressed as Spatial Frequency Response (SFR), also known as Modulation Transfer Function (MTF)) and Lateral Chromatic Aberration from images that contain registration mark patterns (circles that contain two light and two dark quadrants). This document shows how to run SFRreg in Rescharts and how to save settings for automated runs. Part 1 introduced SFRreg and explained how to obtain and photograph the chart. Part 3 illustrates the […]

Using SFRplus Part 2

Running SFRplus (Interactive and Auto mode settings) Imatest SFRplus performs highly automated measurements of several key image quality factors using a specially-designed test chart. This document shows how to run SFRplus in Rescharts and how to save settings for automated runs. Part 1 introduced SFRplus and explained how to obtain and photograph the chart. Part 3 illustrates the results. New in Imatest 3.10 SFRplus settings can be updated by clicking Settings, SFRplus Auto settings in the Imatest main window without having to read an image file into Rescharts SFRplus Setup. New in Imatest 3.9 SFRplus can be run without including […]

Using SFRplus, Part 3: Results

Imatest SFRplus results Imatest SFRplus performs highly automated measurements of several key image quality factors using the specially-designed SFRplus test chart. Unlike most other modules, the user never has to manually select Regions of Interest (ROIs). Image quality factors include Sharpness, expressed as Spatial Frequency Response (SFR), also known as the Modulation Transfer Function (MTF), Noise, Lateral Chromatic Aberration, Distortion (with nearly as detailed output as the Distortion module). Described in detail here. Tonal response (again, with less detail than Stepchart; no noise statistics) Color accuracy, when used with an SFRplus that contains the optional color pattern, located above the […]

Using Stepchart

Photographing the chart – Running Stepchart – Settings – Output – Temporal noise Auto-exposure – Saving – Dynamic range (DR) – DR definitions – Algorithm   Stepchart measures the tonal response, noise, dynamic range, and ISO sensitivity of digital cameras and scanners using Reflective grayscale step charts such as the Kodak/Tiffen Q-13 and Q-14 Gray Scales, which have a single row of patches (a linear arrangement), or charts such as the ISO-14524 or ISO-15739 charts, with non-linear (multiple rows; may be circular) patch arrangements, shown below, or Transmissive (backlit) grayscale step charts such as the Imatest 36-patch Dynamic Range or 36-patch […]

Using SFRplus Part 1

The SFRplus chart: description and how to photograph it Watch on YouTube. Download 1080p/720p/540p. Purchase SFRplus Test Charts from the Imatest Store. Imatest SFRplus performs highly automated measurements of several key image quality factors using a specially-designed test chart that may be purchased from the Imatest store (recommended) or printed on a high-quality inkjet printer. The user does not need to manually select Regions of Interest (ROIs). Image quality factors include Sharpness, expressed as Spatial Frequency Response (SFR), also known as Modulation Transfer Function (MTF), which can be mapped over the entire image, Noise (limited: eSFR ISO has more detailed […]

Using Screen Patterns

Monitor patterns for Light Falloff, SFR, Distortion, and monitor calibration Introduction Screen Patterns displays a variety of test patterns on monitors, preferably on LCD flat screen monitors. It may become more useful as cost-effective ultra-high resolution (4k+) monitors become available. It is opened by clicking on Screen Patterns on the right of the Imatest main window. Most patterns (except perhaps Monitor calibration) perform best with the window maximized. You may need to redraw the pattern after maximizing (or resizing) it by selecting the pattern or changing one of the settings. These patterns are offered as a convenient alternative to the […]

Using SFR Part 1

Setting up and photographing SFR test charts Imatest SFR measures spatial frequency response, also known as the Modulation Transfer Function (MTF), of digital cameras using a slanted-edge (light-to-dark) target, as described in Sharpness: What is it and how is it measured? Although it doesn’t provide the as strong a visual indication of MTF as wedge or sinusoidal chats (such as Log Frequency), it provides a more accurate quantitative measurement and uses space much more efficiently. Old ISO 12233:2000 test chart (left) with Imatest SFR cropping indicated by the red rectangle New ISO 12233:2014 test chart (right– supported with a high […]

Using Rescharts slanted-edge modules Part 2

Running Rescharts slanted-edge modules (Interactive and Auto mode settings) Imatest Rescharts slanted edge modules— SFRplus, eSFR ISO, SFRreg, and Checkerboard— perform highly automated measurements of several key image quality factors using specially-designed test charts. This document shows how to run these modules in Rescharts and how to save settings for automated runs.  Four introductory pages —  SFRplus, eSFR ISO, SFRreg, and Checkerboard — describe each module and explain how to obtain and photograph the chart.  Rescharts Results Part 3 and Part 4 illustrate the results. Selecting files – Setup window – ROI selection & analysis – Edge ID files – Speeding up runs […]

Using SFR part 2: Running Imatest SFR

From the Imatest main window, click on SFR or Rescharts on the upper left. SFR allows you to analyze multiple regions and to run batches of files. Rescharts (1. Slanted-edge SFR) allows you to analyze single regions in a highly-interactive interface. ISO 12233:2000 chart images, which have contrasty (≥40:1) slanted-edges, can be downloaded from dpreview.com reviews, typically in the last page titled “Compared to…,” and from Imaging-resource.com reviews, typically on the page labeled “sample images.” We no longer recommend such high contrast images, because saturation can lead to inaccurate results. 4:1 or 10:1 contrast images are much preferred. Image file […]