Search Results for: MTF
Using SFRplus Part 2
Running SFRplus (Interactive and Auto mode settings) Imatest SFRplus performs highly automated measurements of several key image quality factors using a specially-designed test chart. This document shows how to run SFRplus in Rescharts and how to save settings for automated runs. Part 1 introduced SFRplus and explained how to obtain and photograph the chart. Part 3 illustrates the results. New in Imatest 3.10 SFRplus settings can be updated by clicking Settings, SFRplus Auto settings in the Imatest main window without having to read an image file into Rescharts SFRplus Setup. New in Imatest 3.9 SFRplus can be run without including […]
IT-DLL Instructions
How Imatest IT/DLL works Imatest IT/DLL (Industrial Testing DLL; formerly API/DLL) is a library that allows developers to access Imatest‘s powerful image quality analysis tools via calls to functions residing in a Dynamic Link Library. At the present time (in Imatest 4.4) it supports calls from C and C++ , .NET (including C# and VB.NET), and Python. Support for LabVIEW is under development. DLL modules perform the same calculations as the corresponding GUI-based Imatest Master modules. Fifteen modules are available: SFR SFRplus Star OIS Colorcheck Stepchart Wedge Random Uniformity (Light Falloff) Distortion eSFR ISO SFRreg […]
Imatest with ON Semiconductor DevWare
Introduction This page illustrates how to use image acquisition with ON Semiconductor DevWare, which is a part of ON Semiconductor’s DevSuite. Imatest also supports other development systems. Load images directly from DevWare. This eliminates the need to capture images separately, store them, then load them individually into Imatest, dramatically improving productivity. Note: As of Imatest 5.0 image acquisition capabilities were added to Imatest Master and Imatest IS was discontinued. Learn more. Download and Install Software To download Imatest Master software, go to www.imatest.com/products/imatest-master/ Download and open the self-extracting executable (Imatest-IS-3.n.exe). This will install Imatest and the Matlab Compiler Runtime (MCR), which is required for […]
Imatest IT/EXE instructions
How Imatest IT/EXE works Imatest IT/EXE (Industrial Testing EXE; formerly API/EXE) is a set of standalone programs initiated by DOS calls, which can be issued by a test system. The programs have the same functionality as the corresponding Imatest Master modules, but they operate without user intervention, making them suitable for use in automated testing systems. They are represented by the blue box in the lower right of the figure below. Imatest IT/EXE flow diagram The test system interacts with the IT/EXE programs through files specified in the DOS command line— primarily an image file and an INI control file […]
Imatest IT/.NET Instructions
How Imatest IT/.NET works Imatest IT/.NET (Industrial Testing .NET) is a Microsoft .NET Framework library that allows developers to access Imatest‘s powerful image quality analysis tools via calls to methods residing in a .NET DLL library. The library methods perform the same calculations as the corresponding GUI-based Imatest Master modules. Imatest IT/.NET is compatible with .NET Framework versions 4.5 and higher. Fourteen modules are available: SFR SFRplus Star Colorcheck Stepchart Wedge Uniformity (Light Falloff) Distortion eSFR ISO Blemish Dot Pattern Multitest OIS Random Imatest IT/.NET is a complete package that includes the module libraries, […]
Imatest IT Modules & Tests
Test Item Imatest Module
Skype for Business Video Specification Support
Instructions and comments Under development We are updating this page for the latest Skype for Business Video Capture Specification, December 2016. An index of of the Skype/Lync specifications can be found on https://technet.microsoft.com/en-us/office/dn788953 This document contains instructions for using Imatest with the Skype for Business Video Capture Specification, which has two versions: personal solutions (Document Number: H100693) and conferencing devices (Document Number: M1023160), published December 2016. “Skype for Business V3.0” appears on a watermark, and 3.0 is indicated in the Revision History (Section 1). It also contains comments and suggestions for running Imatest. The Skype spec uses only a tiny […]
Three optical centers
Customers frequently want to know how we measure the optical center of the image (not to be confused with the geometrical center). They may be surprised that we measure three, shown below in the 2D contour map, which is one of the options in Rescharts slanted-edge modules 3D & contour plots. SFRplus contour plot for MTF50P, showing three optical centers: For a normal well-constructed lens, the optical centers are all close to the geometric center of the image. They can diverge for defective or poorly-constructed lenses. Center of MTF (Center of Sharpness) The center of MTF (or Sharpness) is the […]
Using direct image acquisition
Direct image acquisition allows images to be captured directly from a variety of devices without first being stored as files. It has several important applications. Introduction – Direct data reload for realtime analysis – Signal averaging By continuously reloading images, it can be used for realtime (or near-realtime) image analysis, where “realtime” means that analysis appears to be instant in the timeframe of human perception. It is especially valuable for focusing with slanted-edges (which can be analyzed faster than other MTF patterns) or with cropped areas of arbitrary images. It is very useful for signal averaging — a technique […]
Real-time focusing with Imatest Master direct data acquisition
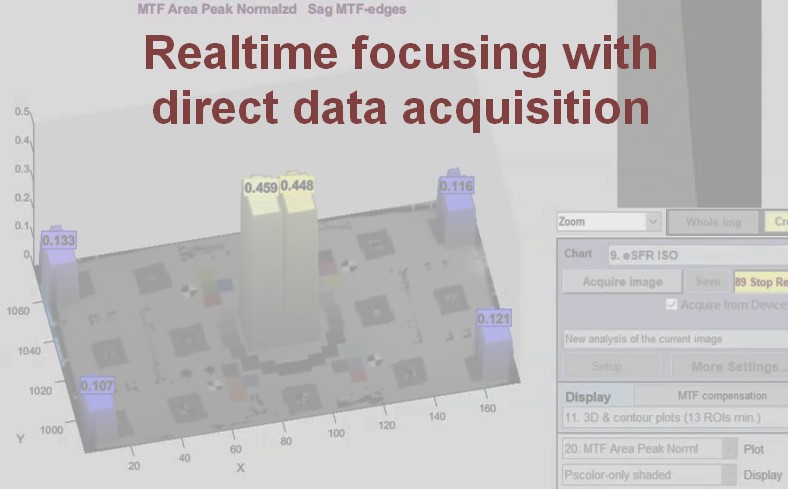
Speed up your testing with real-time focusing in Imatest Master 2020.2. Recent speed improvements allow for real-time focusing and allow users to analyze images from two types of sources: Direct image acquisition from a variety of devices, listed in detail in Supported image acquisition hardware for Imatest Master. Image files listed in Image file formats and acquisition devices, Although the majority of images traditionally analyzed by Imatest have been from files (JPG, PNG, etc.), three modules, which can perform a majority of Imatest’s analyses, support direct data acquisition, and can be used for realtime analysis.
Wedge
Analysis of hyperbolic or trapezoidal wedge patterns with the Imatest Wedge and eSFR ISO modules Introduction Imatest Master and IS can analyze wedge patterns in two modules, both of which may be run from the interactive Rescharts interface or as fixed (batch-capable) modules. The Wedge module (described in this document) can analyze any arrangement of horizontal or vertical (but not diagonal) wedges, using manual region selection. The eSFR ISO module can analyze pairs of wedges on the Enhanced and Extended eSFR ISO charts (including the charts with extra wedges), introduced in April 2014. Region detection is fully automated. The user […]
Version Comparison: Studio vs. Master
Which version is right for you? Imatest 5.0: All functions of Imatest Image Sensor have been incorporated into Imatest Master. Imatest is available in several GUI (Graphic User Interface)-based versions. Studio, with everything individual photographers need to test their cameras and lenses. Studio is only available to individual photographers. Master, the full-featured industrial-strength version for engineers and scientists who develop and evaluate imaging systems. Acquire images directly from several manufacturer’s development systems. Images can be updated and analyzed in real time with the Rescharts, Multicharts, and Uniformity-Interactive modules. As of Imatest 5.0, Image Sensor (IS) has been discontinued. All […]
Using Test Charts
Create test charts for high quality inkjet printers Although we strongly recommend that customers purchase charts from the Imatest Store, the Imatest Test Charts module allows you to create test chart files for printing on high quality photographic inkjet printers. If you plan to print charts using this module, you should be skilled at fine printing and have a knowledge of color management to obtain optimum chart quality; otherwise we recommend purchasing charts at the Imatest Store. Disclaimer: Although we sell most of the charts generated by the Imatest Test Charts module, several variations are not available because (A) it’s […]
Using SFRreg, Part 3: Results
Imatest SFRreg performs highly automated measurements of sharpness (expressed as Spatial Frequency Response (SFR), also known as Modulation Transfer Function (MTF)) and Lateral Chromatic Aberration from images that contain registration mark patterns (circles that contain two light and two dark quadrants). This document illustrates SFRreg results. Part 1 introduced SFRreg and explained how to obtain and photograph the chart. Part 2 showed how to run SFRreg inside Rescharts and how to save settings for automated runs. SFRreg results When calculations are complete, results are displayed in the Rescharts window, which allows a number of displays to be selected. The following […]
Using SFRreg, Part 2: Running SFRreg
Running SFRreg (Interactive and Auto mode settings) Setup window – ROI numbering – More settings – SFRreg target detection Auto mode settings – Warnings – Summary Imatest SFRreg performs highly automated measurements of sharpness (expressed as Spatial Frequency Response (SFR), also known as Modulation Transfer Function (MTF)) and Lateral Chromatic Aberration from images that contain registration mark patterns (circles that contain two light and two dark quadrants). This document shows how to run SFRreg in Rescharts and how to save settings for automated runs. Part 1 introduced SFRreg and explained how to obtain and photograph the chart. Part 3 illustrates the […]
Using SFRreg Part I
Imatest SFRreg performs highly automated measurements of sharpness (expressed as Spatial Frequency Response (SFR), also known as Modulation Transfer Function (MTF)) and Lateral Chromatic Aberration from images that contain registration mark patterns (circles with two light and two dark quadrants). Unlike standard test charts, these patterns do not need to be located on a flat (planar) surface. Since Region of Interest (ROI) detection is automatic, they may be positioned where needed. Depending on the image source, they offer several advantages. You can Test images at infinity distance (or any distance of choice) using a compact projection system such as a collimator […]
Using Stepchart
Photographing the chart – Running Stepchart – Settings – Output – Temporal noise Auto-exposure – Saving – Dynamic range (DR) – DR definitions – Algorithm Stepchart measures the tonal response, noise, dynamic range, and ISO sensitivity of digital cameras and scanners using Reflective grayscale step charts such as the Kodak/Tiffen Q-13 and Q-14 Gray Scales, which have a single row of patches (a linear arrangement), or charts such as the ISO-14524 or ISO-15739 charts, with non-linear (multiple rows; may be circular) patch arrangements, shown below, or Transmissive (backlit) grayscale step charts such as the Imatest 36-patch Dynamic Range or 36-patch […]
Using SFRplus Part 2
Running SFRplus (Interactive and Auto mode settings) Imatest SFRplus performs highly automated measurements of several key image quality factors using a specially-designed test chart. This document shows how to run SFRplus in Rescharts and how to save settings for automated runs. Part 1 introduced SFRplus and explained how to obtain and photograph the chart. Part 3 illustrates the results. New in Imatest 3.10 SFRplus settings can be updated by clicking Settings, SFRplus Auto settings in the Imatest main window without having to read an image file into Rescharts SFRplus Setup. New in Imatest 3.9 SFRplus can be run without including […]
Using SFRplus, Part 3: Results
Imatest SFRplus results Imatest SFRplus performs highly automated measurements of several key image quality factors using the specially-designed SFRplus test chart. Unlike most other modules, the user never has to manually select Regions of Interest (ROIs). Image quality factors include Sharpness, expressed as Spatial Frequency Response (SFR), also known as the Modulation Transfer Function (MTF), Noise, Lateral Chromatic Aberration, Distortion (with nearly as detailed output as the Distortion module). Described in detail here. Tonal response (again, with less detail than Stepchart; no noise statistics) Color accuracy, when used with an SFRplus that contains the optional color pattern, located above the […]
Using SFRplus Part 1
The SFRplus chart: description and how to photograph it Watch on YouTube. Download 1080p/720p/540p. Purchase SFRplus Test Charts from the Imatest Store. Imatest SFRplus performs highly automated measurements of several key image quality factors using a specially-designed test chart that may be purchased from the Imatest store (recommended) or printed on a high-quality inkjet printer. The user does not need to manually select Regions of Interest (ROIs). Image quality factors include Sharpness, expressed as Spatial Frequency Response (SFR), also known as Modulation Transfer Function (MTF), which can be mapped over the entire image, Noise (limited: eSFR ISO has more detailed […]