Grayscale charts for Color/Tone and Stepchart

In addition to linear step charts (which have a single row of patches), three Imatest modules— Stepchart, Color/Tone Interactive (formerly Multicharts), and Color/Tone Auto (formerly Multitest)— can analyze the tonal response and noise of a number of additional multi-row grayscale charts (reflective and transmissive), most of which are available from the Imatest Store. With most of these charts you can choose between default reference values and a custom reference file that you can measure, or (for 26-patch Dynamic Range charts) are supplied by Imatest. The recommended charts on this page are the 36-patch Dynamic range, ISO-14524, ISO-15739, and 20-patch circular […]

Star Chart

 Analyze the Siemens Star chart News:  Imatest 2020.1 (Feb. 2020)  Shannon information capacity can be calculated from images of the Siemens star, with much better accuracy than slanted-edges. The old slanted-edge method has been deprecated. The new feature will be available in the Pilot program prior to the release.  The white paper, “Camera information capacity: a key performance indicator for Machine Vision and Artificial Intelligence systems“, which briefly introduces information theory, describes the camera information capacity measurement, then shows results (including the effects of artifacts) is now available for download. Imatest 5.0: Half-stars (rotated by multiples of 45º) can now […]

RAW Files

Introduction – Using RAW files – Bayer RAW and RCCC files – dcraw demosaicing – DNG files – Rawview utility – Generalized Read Raw – Decompanding – Creating Synthetic raw images   The unprocessed digital output of an image sensor is called RAW image data. In this document, we sometimes refer to RAW files from commercial cameras or development systems as Camera RAW to distinguish them from Bayer RAW files, which are standard monochrome image files that contain undemosaiced (Bayer) data. Bayer Color Filter Array (CFA)  The pixels in most digital image sensors are covered with the Bayer CFA, which makes […]

Imatest CPIQ support

Starting with Imatest 3.9, Imatest provides strong support for CPIQ (Camera Phone Image Quality)* Phase 2 measurements. Further detail is available in the CPIQ 2.0 Specifications & Test Methods document. Contact us if you need further information. We are members of CPIQ, and we will will add updated measurements as they become available (expected in early 2016). *CPIQ formerly belonged to I3A (International Imaging Industry Association). It now belongs to the IEEE Standards Association, Working Group P1858. SFR and Acutance For CPIQ, sharpness is measured as Spatial frequency response (SFR) (also called Modulation Transfer Function (MTF)). The SFR, SFRplus ( […]

Acutance and SQF (Subjective Quality Factor)

Introduction to Acutance and SQF   Acutance and Subjective Quality Factor (SQF) are measures of perceived print or display sharpness. SQF was used for years in the photographic industry but has remained unfamiliar to most photographers. Acutance is a relatively new measurement from the IEEE Camera Phone Image Quality (CPIQ) group. Both are metrics which incorporate the effects of The imaging system: The Modulation Transfer Function (MTF) of the camera as a measurement of its intrinsic sharpness. The viewer: The human eye’s sensitivity to each spatial frequency modeled with a Contrast Sensitivity Function (CSF). The viewing conditions: The image display height […]

Color/Tone & eSFR ISO noise measurements

including raw (image sensor), chroma, and visual noise as well as several types of Dynamic Range calculation News– Imatest 5.2: Multicharts (the highly interactive module for measuring color accuracy, tonal response, and noise) has been renamed to Color/Tone Setup, and Multitest (the fixed/batch-capable version of Multicharts) has been renamed to Color/Tone Auto. For now the old names will be used for INI file sections. An INI File Monitor captures the contents of INI files (which can be used control Imatest IT runs), and displays them in a web browser table.  Imatest 5.1: Color/Tone Setup and Auto can now measure temporal […]

Documentation – v2020.1

View Release Notes   Index of the Table of Contents Offline documentation Download the website for offline view (with a web browser) Image Quality  IQ factors (KPIs) measured by Imatest, with links to detailed descriptions and instructions. Sharpness  Introductions to sharpness and sharpening; comparisons of different charts; chart quality limitations & how to overcome them Other IQ factors  Noise, SNR, Temporal noise, Dynamic Range (DR),  Chromatic Aberrations, Distortion, Veiling glare, Shannon information capacity, etc. IQ Utilities  Image Processing, SSIM, Image Statistics, Radial geometry  Getting started Why Imatest?, Test charts, Lighting, Image capture technique, Setting up your lab, Using Imatest software […]

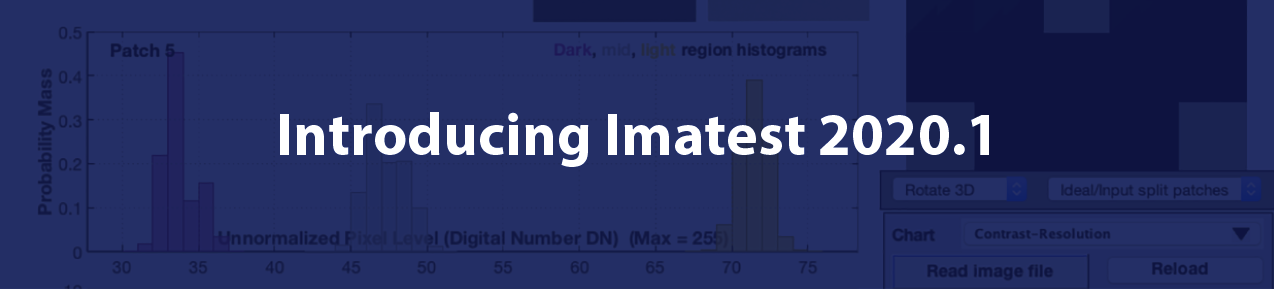
Imatest is Attending Electronic Imaging 2020

Imatest is attending Electronic Imaging 2020 in Burlingame, California on January 26-30, 2020. The symposium brings together 17 technical conferences covering all aspects of electronic imaging.

Lighting Considerations

When selecting light sources, consider ones with high uniformity to ensure accurate chart readings (refer here for the effects of non-uniform lighting on sharpness measurements). Integrated dimming capabilities can be useful when measuring imaging system quality across different levels of light to simulate multiple real-world scenes. Uniformity Uniformity measurements indicate an imaging system’s tendency to become darker the farther away from the center of the image. This occurrence is due to the radial nature of the lens which collects more light in the center and can be particularly strong with wide angle lenses. Testing for uniformity requires light sources with […]

Lighting Considerations

Uniformity      Reflective Mounting      Transmissive Chart Mounting When selecting light sources, consider ones with high uniformity to ensure accurate chart readings (refer here for the effects of non-uniform lighting on sharpness measurements). Integrated dimming capabilities can be useful when measuring imaging system quality across different levels of light to simulate multiple real-world scenes. Uniformity Uniformity measurements indicate an imaging system’s tendency to become darker the farther away from the center of the image. This occurrence is due to the radial nature of the lens which collects more light in the center and can be particularly strong with […]

Test Lab Setup

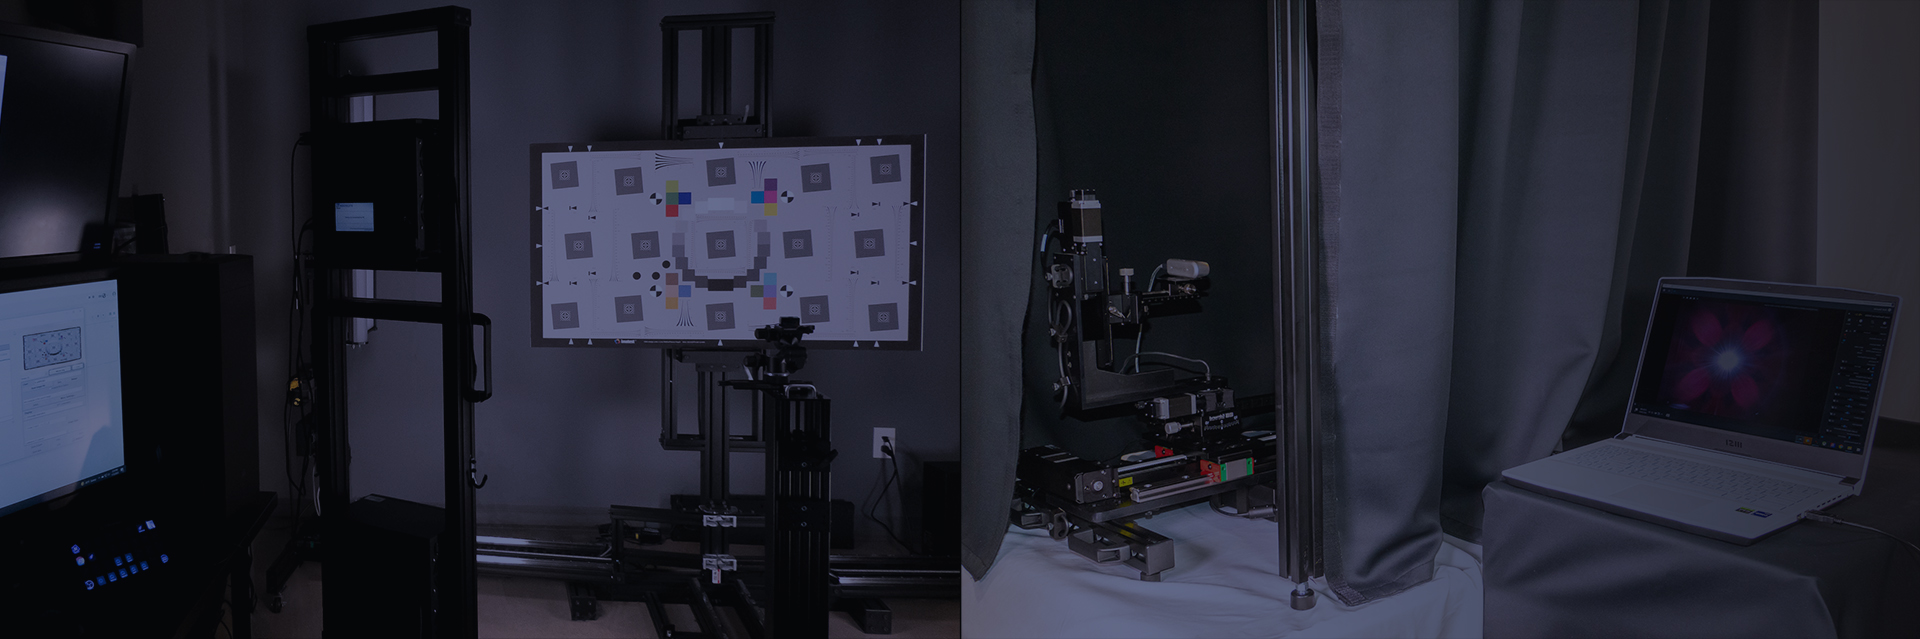
Environment Chart Mounting Test Lab Equipment Lighting Addressing Glare Lighting Uniformity Requirements Software Direct Image Acquisition   A proper testing lab setup is essential for obtaining reliable, repeatable image quality measurements. And before configuring your lab with charts and equipment, consider the following: Field of View (FOV) Considerations Test Chart Considerations Lighting Considerations Note: If you are photographer, student, and artist using Imatest Studio user, please refer to our Photography lab setup guide for relevant information. Environment To obtain precise measurements, your test lab should be set up in a space with little ambient lighting such as an interior, windowless room. […]

ISO 12233 eSFR Charts for Imatest LED Light Sources

The ISO12233:2017 eSFR Test Charts listed here are Pre-Mounted for use with Imatest LED Light Sources. This chart is designed to work with the eSFR ISO Module. Imatest 

ISO 12233:2017 eSFR Test Charts are implementations of the Low Contrast Edge SFR (eSFR) test chart illustrated in Section 6.1 and Annex C of the ISO Standard DocumentThe chart is available in two general versions:

  • Enhanced: extra squares, wedges, and color patterns when printed with technologies that allow color
  • Extended: similar to Enhanced, but with a 16:9 aspect ratio, suitable for HDTV and cinema (Note: Works with Matlab esfrChart)

Download PDF Info Sheet

Lead Time: 3 Weeks

Spilled Coins Charts for Imatest LED Light Sources

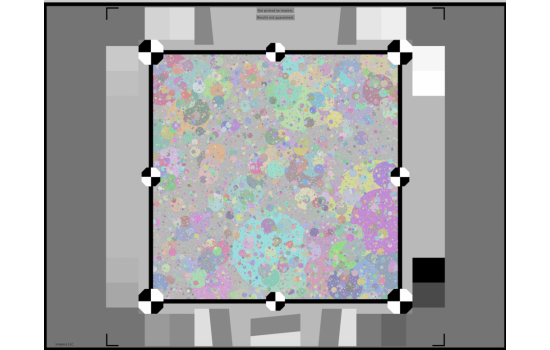
The Imatest Spilled Coins chart is designed to measure texture sharpness. It has offers nearly perfect scale-invariance, which improves the accuracy and robustness of measurements, as well as gray regions to the left and right of the chart that facilitate noise removal.

The Imatest Spilled Coins Cross test chart uses cross-correlation calculation texture metrics to provide improved stability for images with nonlinear noise reduction. Users can now more accurately differentiate between noise and texture. Random/Dead Leaves Cross, which runs under the interactive Rescharts interface, measures SFR (Spatial Frequency Response) or MTF (Modulation Transfer Function) from these patterns

Learn more about the Spilled Coins Pattern and it’s use through the Rescharts Module

Lead Time: 3 Weeks

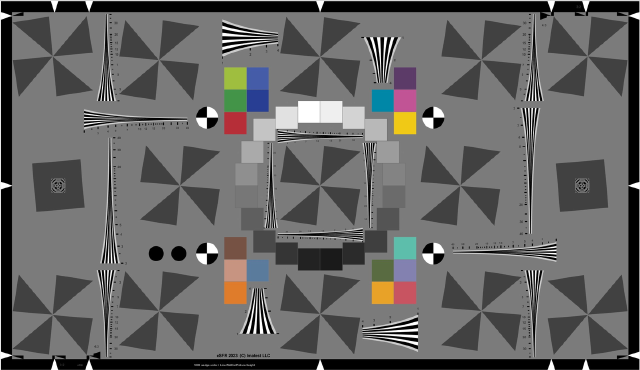
SFRplus Charts for Imatest LED Light Sources

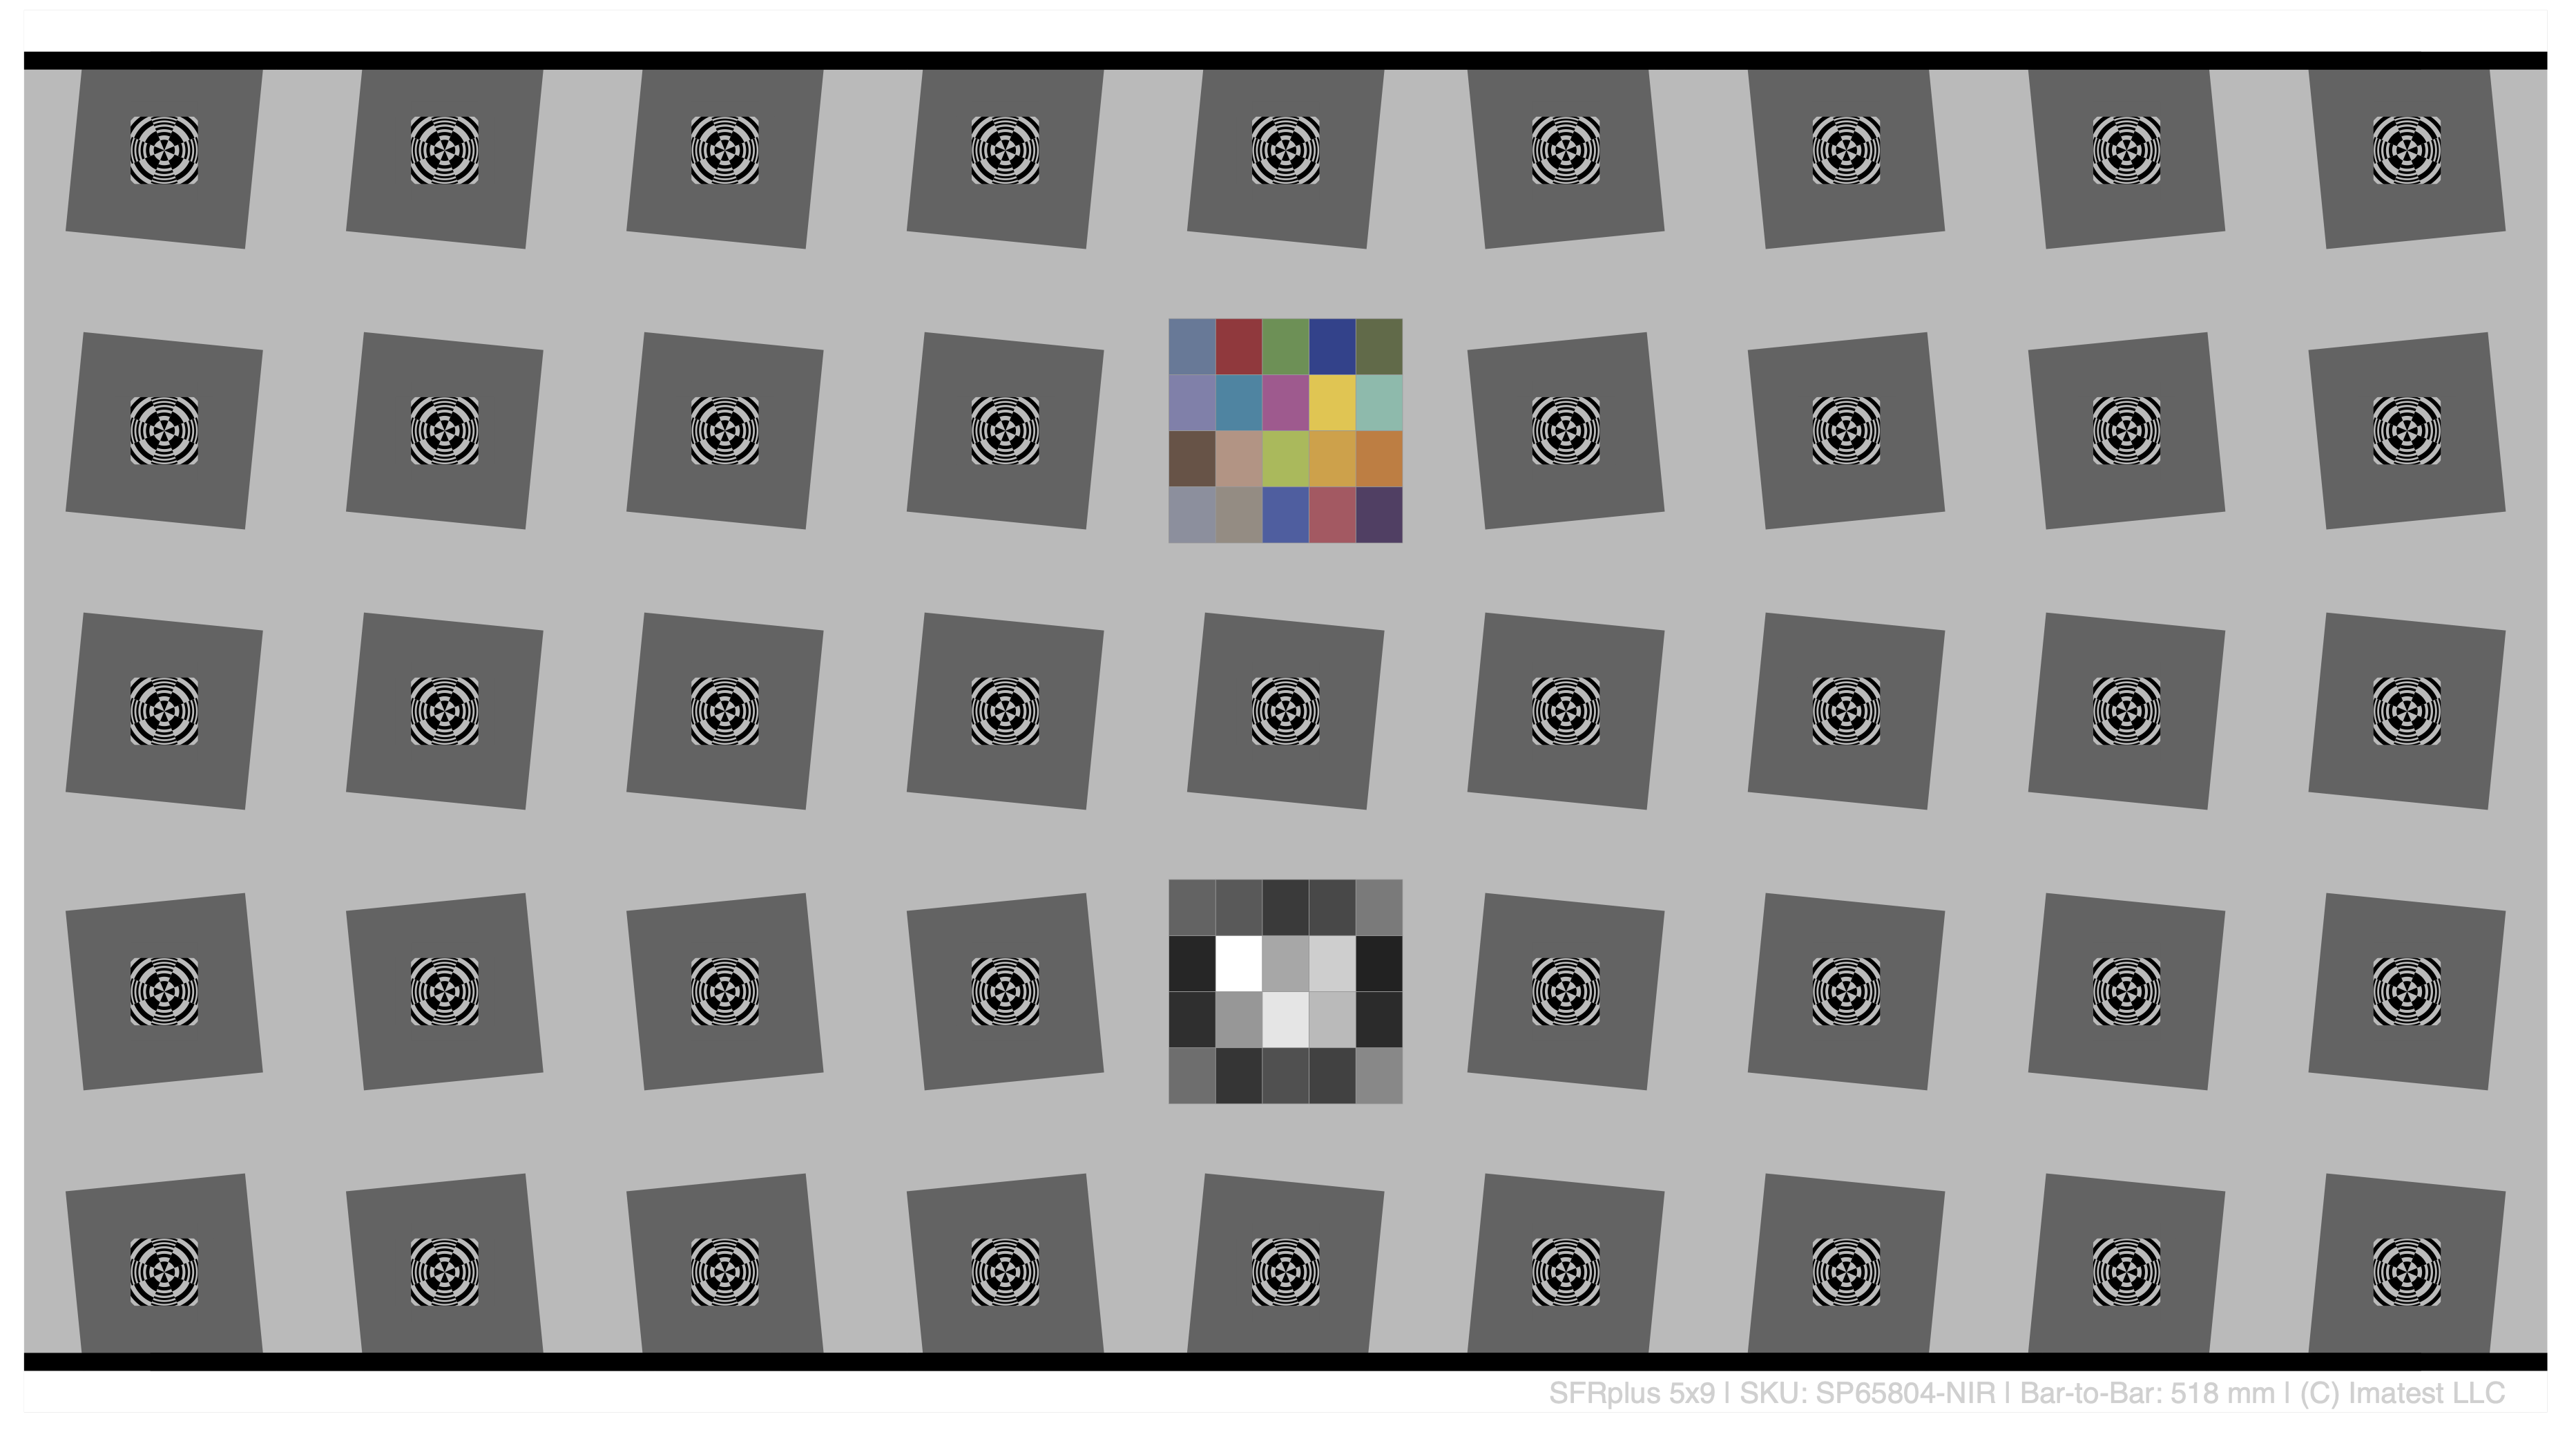
The SFRplus Test Charts are available Pre-Mounted for use with Imatest LED Light Sources. This test chart can be used with the SFRplus Module in Imatest to measure MTF, lateral chromatic aberration, distortion, tonal response, and color accuracy, and offers full support for automated image quality testing. Learn more about the SFRplus Module

Download PDF Info Sheet

Lead Time: 3 Weeks

Photography Lab Setup

Test charts Lighting Glare-free, uniform illumination of your test chart is ideal for Imatest software to accurately measure the image quality of your camera. This can be achieved using reflective or transmissive light sources. Reflective inkjet chart lighting Widely available LED shop lights provide an excellent solution for Imatest Studio customers whose primary interest is testing camera and lens sharpness. Little assembly is required with the exception of the need to mount them. You may need more than one type of light because they typically have just one color temperature (e.g. 4000K) and have a relatively low Color Rendering Indices (around […]

Checkerboard Charts for Imatest LED Light Sources

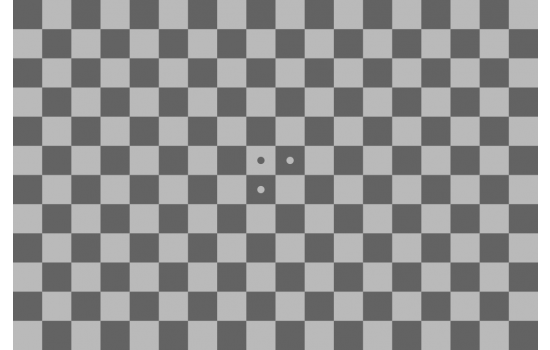
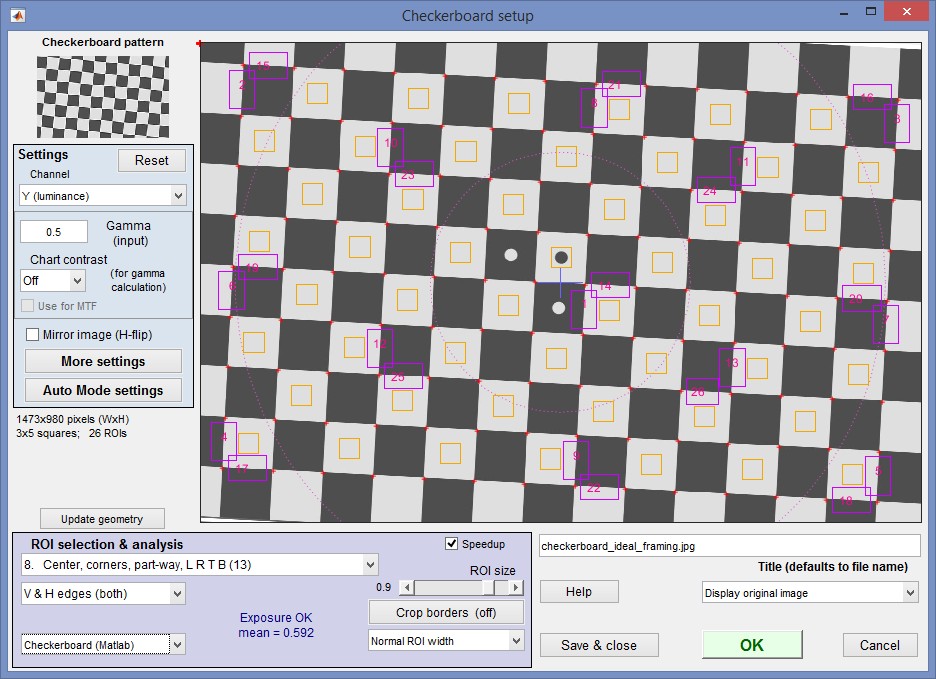
The Checkerboard Test Charts are available Pre-Mounted for use with Imatest LED Light Sources. This chart is designed to work with the Checkerboard module. This module enhances testing of varying distances by supplying more testable regions to provide automated measurements of sharpness, lateral chromatic aberration, and distortion from images.

Learn more about the Checkerboard Module.  Please note that this module runs slower than eSFR ISO and SFRplus modules and is less tolerant to extreme amounts of defocus or blooming degradations.

Download PDF Info Sheet

Lead Time: 3 Weeks

Which Imatest Charts Support Automatic Detection?

Using testing charts (also known as targets) improves the efficiency and repeatability of your testing workflow. Imatest offers several charts that support automatic detection as well as charts with registration marks.

Imatest 5.2 Release Notes

New Features and Enhancements ON Semiconductor DevwareX support for this advanced image sensor interface software, which replaces Devware. Support for the APbase image acquisition API. Decompanding for the proper processing of piecewise linear (PWL) companded RAW files, which can extend sensor dynamic range by allowing different tonal curves for ranges of digital output values. Contrast Detection Probability (CDP) from Contrast Resolution chart using low-contrast path triplets to calculate the draft IEEE P2020 metric. CDP is a metric for the distinguishability from two input light levels through an imaging system. Improved Color/Tone Module Interfaces – Chart selection is clearer and more […]

Nonuniformity Correction in grayscale and color chart modules

Imatest can correct for nonuniform illumination and lens response (vignetting) in Imatest modules that analyze grayscale and/or color charts, including Color/Tone Setup (formerly Multicharts), Color/Tone Auto (formerly Multitest), Colorcheck, and Stepchart. Nonuniformity correction involves reading and specifying a second image, taken from a flat-field target (plain gray or white) under identical conditions to the test image.  Note that the correction described in this page is not the same as nonuniformity correction for slanted-edge MTF measurements. Not also that Multicharts (a highly interactive module) and Multitest (a batch-capable fixed version of Multicharts) are recommended for new work. Colorcheck and Stepchart are […]

Contrast Resolution chart and analysis

Introduction Introduction – Background – The Contrast Resolution chart – Photographing & analyzing – Tonal response and SNR – Visualization – Analysis – Contrast Resolution Dynamic Range – Tone mapped results – Summary – Verification This page describes the Imatest Contrast Resolution chart and analysis (supported by Imatest 5.0+), which is designed to measure the visibility of low contrast objects in larger fields over a wide range of brightness. These measurements are expressed as the Contrast Resolution Signal-to-Noise Ratio (SNRCR) and Dynamic Range (DRCR). They are of particular interest to the automotive and security industries. This method of dynamic range measurement was inspired […]