Search Results for: MTF
December 2018 Reading List

Our team has outlined a list of our favorite imaging resources that we use on the job here at Imatest. Take a look at our top picks for the new year. Articles Determining MTF With A Slanted Edge Target This article by Douglas Kerr is a very digestible explanation (with diagrams) of the principles of slanted edge MTF testing. Blogs Image Sensors World Author Vladimir Koifman shares the latest news and discussions on image sensors and image sciencing technology. Books Digital Image Processing This book has been the foundational text for the study of digital image processing for over 40 […]
5 Common Pitfalls in Image Quality Testing
Having trouble with your Imatest test results? This article explains the five most common pitfalls in image quality testing, and how to resolve them. You’re using a chart with overly high contrast, like the obsolete ISO 12233 test chart. Your chart may have too high contrast edges. The most common example we see of this is the obsolete ISO 12233 test chart, although this can be the case with any test chart. If you are using the ISO 12233 2000 test chart, you should not be. The ISO 12233 2000 standard test chart has a very high contrast ratio (the […]
Considerations when evaluating a Near Infrared camera
Recent growth in the automotive and security industries has increased the number of cameras designed for viewing both Near Infrared (NIR) and visible wavelengths of light. NIR illumination is invisible to the human eye and can light a dark scene without being visible or annoying.
Increasing the Repeatability of Your Sharpness Tests
By Robert Sumner With contributions from Ranga Burada, Henry Koren, Brienna Rogers and Norman Koren Consistency is a fundamental aspect of successful image quality testing. Each component in your system may contribute to variation in test results. For tasks such as pass/fail testing, the primary goal is to identify the variation due to the component and ignore the variation due to noise. Being able to accurately replicate test results with variability limited to 1-5% will give you a more accurate description of how your product will perform.
ISO 12233 Edge SFR (eSFR) Inkjet chart
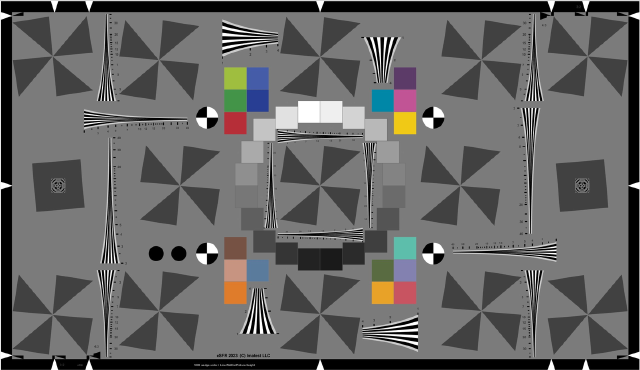
Imatest ISO 12233:2017 and ISO 12233:2023 eSFR charts are implementations of the Low Contrast Edge SFR (eSFR) test chart illustrated in Section 6.1 and Annex C of the ISO Standard Document. The chart is available in two general versions:
- Enhanced: extra squares, wedges, and color patterns when printed with technologies that allow color
- Extended: similar to Enhanced, but with a 16:9 aspect ratio, suitable for HDTV and cinema (Note: Works with Matlab esfrChart)
- All inkjet charts are available in either Visible or Near Infrared and Visible for testing cameras sensitive to wavelengths between 700-1000 nm. Specific spectral data available upon request. We currently offer these charts in inkjet format, with Enhanced versions available as photographic prints. All Imatest ISO 12233 eSFR charts are fully compliant with the ISO standard. The Imatest eSFR ISO module provides highly automated support for the new charts. Additional details below. Download PDF Info Sheet
Introducing Imatest 5.1
Our engineers are continually adding new features and updating Imatest software to provide you with the best analysis tool on the market. In our most recent release, our team has added several new modules to provide you better analysis tools.
Imatest 5.1
Version 5.1 has added several new features on top of the major enhancements made in version 5.0. Among the new features are MTF Compensation, Geometric Calibration, and Sony Sensor Image Acquisition. Not sure if you want it yet? Download a free trial. MTF COMPENSATION GEOMETRIC CALIBRATION DISTORTION CALCULATION TEMPORAL NOISE MEASUREMENTS SONY AYA IMAGE ACQUISITION SYNTHETIC RAW FILE CREATION
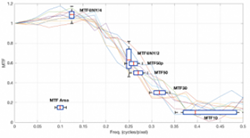
Megapixel suitability for test charts
Megapixel suitability is based on the analysis of the Modulation Transfer Function (MTF) that is obtained from slanted-edge chart images captured at magnifications of around 0.5× (for inkjet charts) or 1× (for photographic charts) using a high quality DSLR or mirrorless camera and macro lens. The calculations are described in the following links: Compensating camera MTF measurements for chart and sensor MTF (Imatest 5.1+); i.e., Introduction, Calculation, MTF compensation files, Applying the compensation, and Lens MTF measurements sections. Chart Quality Calculator (Imatest 5.1+)—determine the suitability of a chart (based on MTF measurements for specific media and print methods) for a specific application. Test […]
Lightbox Uniformity Comparison
Summary table – Detailed uniformity measurements – How we made the measurements Lightbox summary table. Many are no longer available from Imatest Lightbox Brightness Uniformity* CRI (spec.) Viewing Area Dimensions Controls Imatest LED Lightbox 1 to 100,000 lux ** 90 to 95% Over 97 260 x 220 mm to 1440 x 1100 mm (9 Sizes) 400 (W) x 380 (H) x 200mm (D) to 1655 x 1296 x 200 mm (9 Sizes) WiFi, USB, Manual Imatest LED Light Panel 30 to 1,000 lux 90 to 95% 229 x 152mm to 907 x 680mm (5 Sizes) 289 x 212 x 40mm […]
Change Log
To obtain the latest version of Imatest (for updates, new installations, and trial as well as and full versions) go to Imatest Download. Imatest perpetual license holders are entitled to free updates for one year from the date of purchase. After that you need to renew. If your license is not current, you can download and install the version that was current one year after the purchase date. Join Imatest’s Pilot Program and gain early access to new Imatest features and bug fixes. Your feedback is incorporated into each official release to ensure you receive a seamless transition to new versions. […]
Legacy Change Log
The main change log is availabe for newer releases. Date Release Description Oct. 1, 2013 3.10 The new Multitest module (known briefly as ColorTest in 3.10) can analyze all the color and grayscale test charts supported by Multicharts in a fixed (i.e., non-interactive) module that can analyze chart image files in batches. It also includes most Stepchart and Colorcheck function. Five new fixed modules that can also operate in batch mode have been created from Rescharts modules: Random/Dead Leaves, Star chart, Log F-Contrast, Wedge, and Any Image Sharpness. These modules can be accessed by clicking the Modules dropdown menu in […]
Infrared
Imaging systems designed to capture infrared light vary greatly depending on application. Some examples include the automotive and security industries as well as remote sensing and facial recognition. Imatest offers an array of targets that can be analyzed with Imatest Master and Imatest IT to provide statistics and metrics for accurate system benchmarking. Targets Near Infrared (720nm – 1100nm) Near Infrared (NIR) charts can be produced on reflective and transmissive substrates. Inkjet targets work well in the NIR with some tonal adjustments made to compensate for contrast change in the longer wavelengths. Many of Imatest’s […]