Search Results for: MTF
Infrared
Imaging systems designed to capture infrared light vary greatly depending on application. Some examples include the automotive and security industries as well as remote sensing and facial recognition. Imatest offers an array of targets that can be analyzed with Imatest Master and Imatest IT to provide statistics and metrics for accurate system benchmarking. Targets Near Infrared (720nm – 1100nm) Near Infrared (NIR) charts can be produced on reflective and transmissive substrates. Inkjet targets work well in the NIR with some tonal adjustments made to compensate for contrast change in the longer wavelengths. Many of Imatest’s […]
Set of ISO-16505 Test Charts (6 charts)
The ISO-16505 bundle is made up six charts that are mentioned in various parts of the ISO-16505, Road vehicles — Ergonomic and performance aspects of Camera Monitor Systems standard.
This set of charts is available in three standard sizes: 2x, 4x and 5.5x. Select the ISO size you need based on the table below. Click on the ISO size for pricing and to order.
The 2x size replicates the charts as closely as possible to what is described in the standard. The 5.5x is the maximum size Inkjet possible. Custom sizing is available upon request.
Find more information, visit our ISO 16505 Road Vehicle Camera Monitor Systems Solution page and our Automotive Solutions page.
Challenges in Automotive Image Quality Testing

Imatest’s Norman Koren presents his vision for challenges in automotive image quality testing including resolving low-contrast scenarios.
Camera Monitor Systems
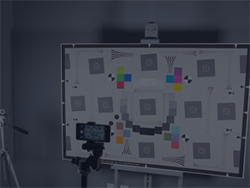
A Camera Monitor System (CMS) consists of a camera, an image processing pipeline, and a monitor for viewing the camera image. Examples include automotive side and rear view mirror replacement systems and medical endoscopes (where the doctor views the endoscope image on the monitor). Although there are good reasons to test the components separately (this lets you find out where degradations occur), sometimes the complete system needs to be tested. for example, camera 1 output (shown below) may not be available. Testing the complete system requires a high-quality camera whose resolution is considerably better than that of the CMS camera […]
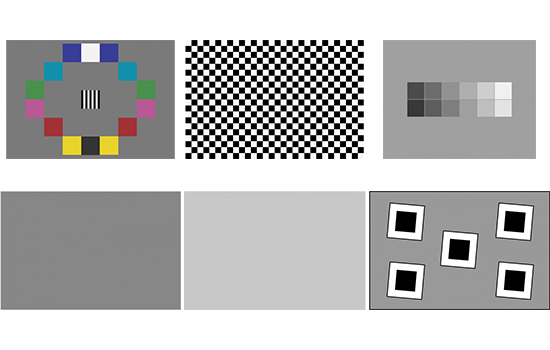
Imatest 36-Patch Dynamic Range Test Charts
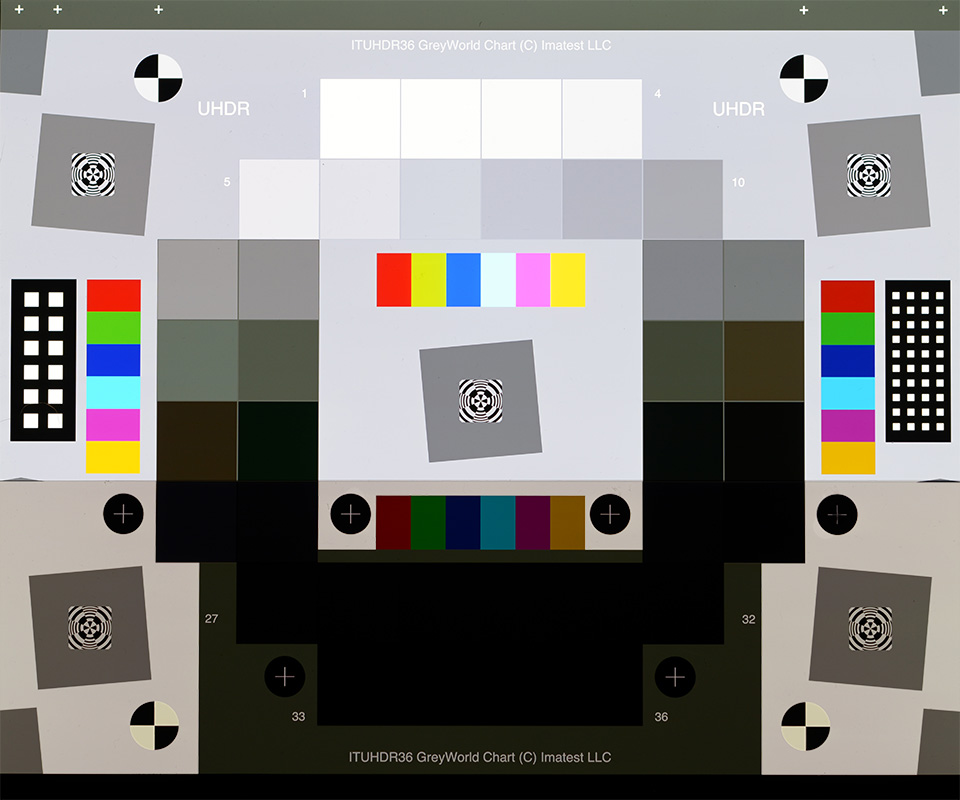
These targets have 36 low-noise density patches and density ranges exceeding 50dB, 100dB and 150dB. The three options fulfill needs for Low, Wide, and Ultra-High Dynamic Range systems. A nearly circular patch arrangement ensures that vignetting has minimal effect on results. For the Wide and Ultra-High variants, there are regions on the left and right sides of the chart for detecting flare light that can interfere with HDR performance. The charts have an active area of 197x235mm (7.75×9.25 inches) on 203x254mm (8×10 inch) high precision LVT film.
Options include an acrylic frame for ease of placement and removal, and the Imatest DarkWorld Mask (see details below). The default frame size fits our size B Lightbox and Light Panel.
Custom pre-distorted versions are available for fisheye lenses. Contact charts@imatest.com.
Rez Checker Target
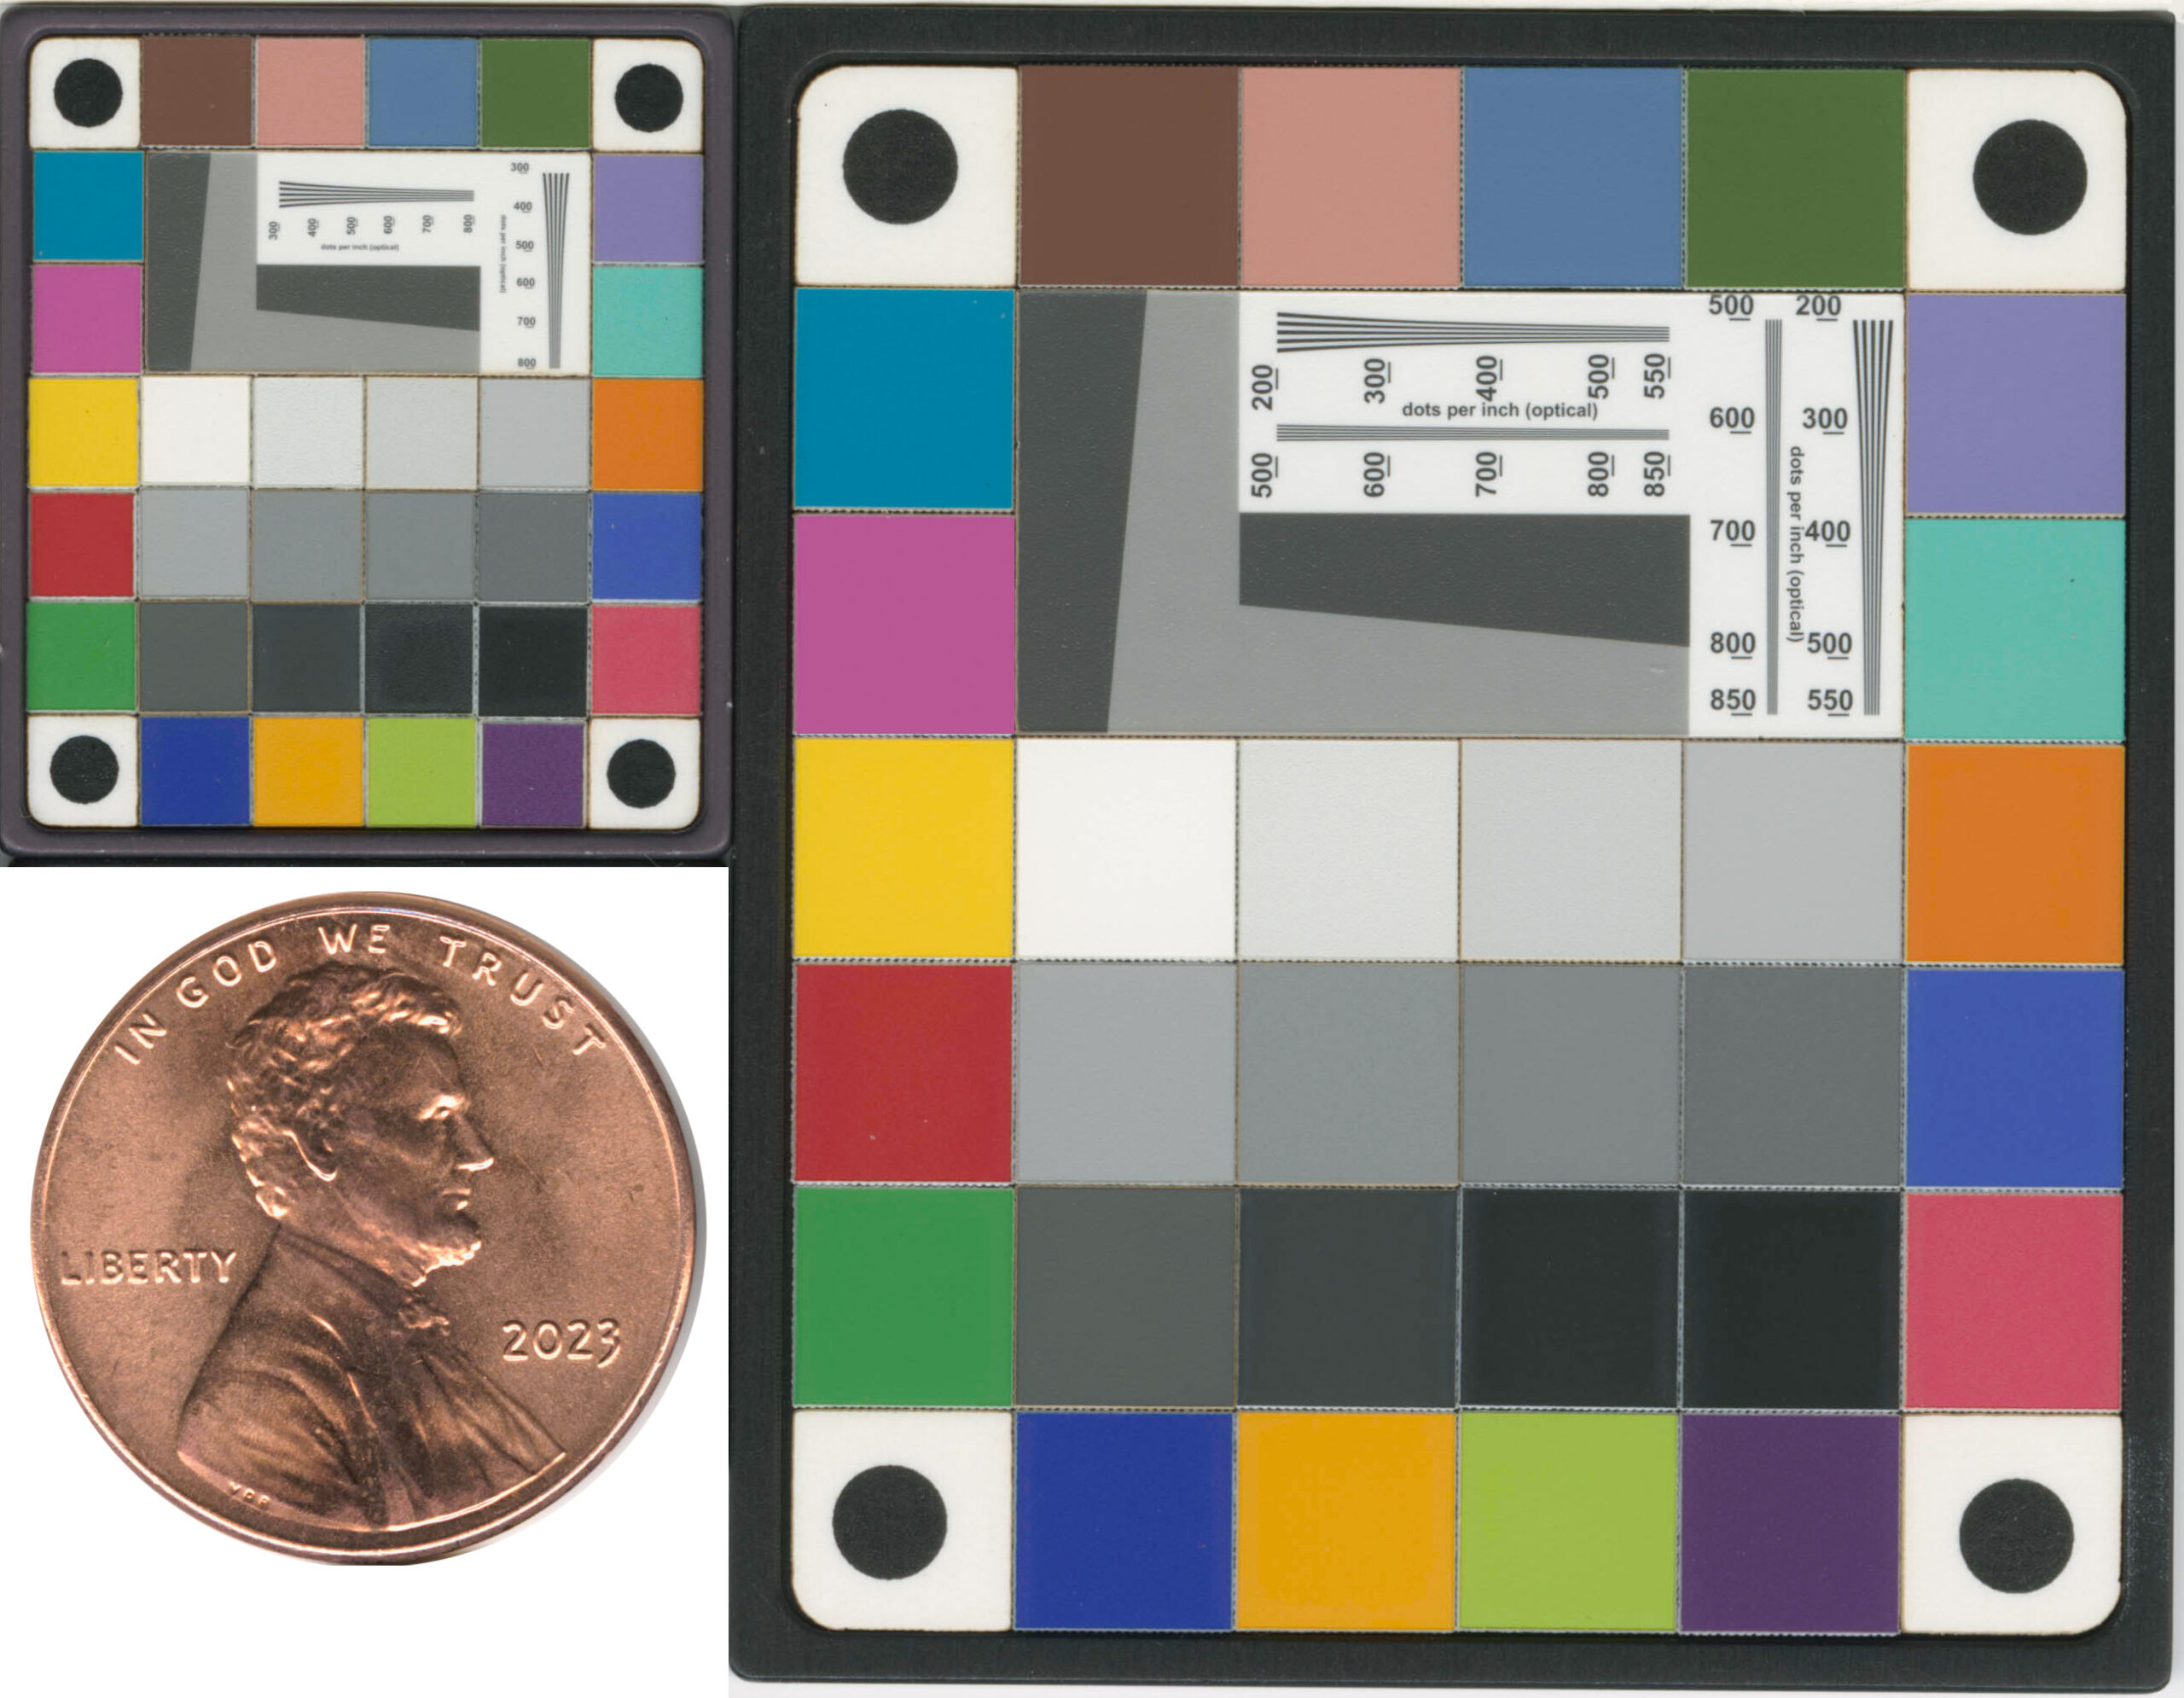
This is a professional grade miniaturized target for assessing color, tone, and white balance in addition to measuring resolution and Spatial Frequency Response (SFR) or Modulation Transfer Function ( MTF) for digital cameras/scanners using edge gradient analysis of ISO 12233 and ISO 16067. All target patches are made in cooperation with Munsell Color Services from the same pigmented color paints as the GretagMacbeth™ ColorChecker®. At center are 12 spectrally neutral gray patches for assessing correct exposure and white balance. (These are NOT ink-jet, photographic, or electro-photographic generated colorants). The slanted edges can be used to reliably measure SFR or MTF out to 3000 dot-per-inch or 60 cy/mm with the appropriate software. Five line visual hyperbolic wedges are also included to aid in visual assessment of limiting resolution to 850 dpi.
Default Reference Data
Download nominal reference data for Matte and Glossy targets.
Display (Monitor) sharpness
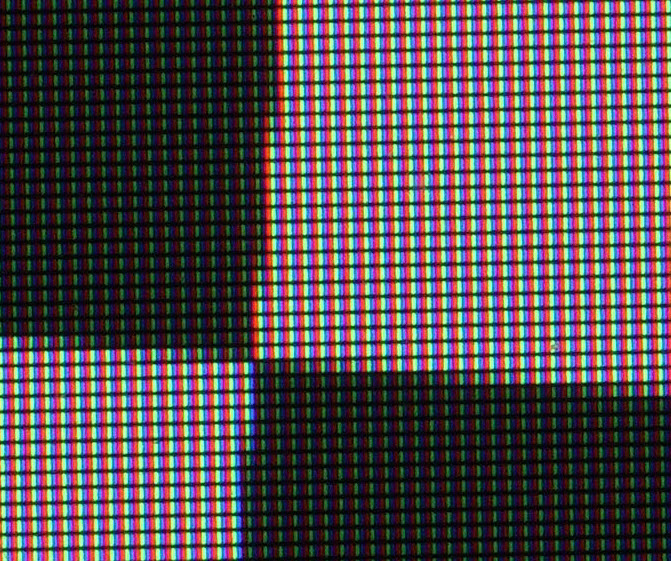
Although Imatest is primarily orientated toward testing cameras, it includes several tests for monitors (displays). It can measure the sharpness of all sorts of displays, including flat panels, projectors, heads up displays (HUDs), virtual & augmented reality head-mounted displays (HMDs) . It can also measure display defects, as described in Testing display defects with Imatest Blemish Detect, as well as the sharpness of Camera Monitor Systems (CMS). This post describes how to measure monitor sharpness. It applies to a large variety of displays and monitors. The technique is similar to CMS measurements, but there are a few differences. Please note […]
Electronic Imaging 2017

Imatest is pleased to announce that they will attend the 2017 IS&T Electronic Imaging conference from January 29 – February 2, 2017. Join us as we discuss, learn about and share the latest developments in electronic imaging technology. You can also email us to set up an appointment in advance.
Testing a macro lens using Checkerboard and Micro Multi-slide
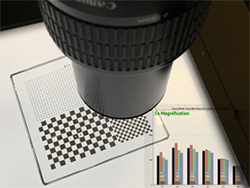
Imatest’s Checkerboard module is our new flagship module for automated analysis of sharpness, distortion and chromatic aberration from a checkerboard (AKA chessboard) pattern. The big benefit of using the checkerboard is that there are looser framing requirements than with other kinds of test targets. While checkerboard lacks the color and tone analysis provided by SFRplus and eSFR ISO, these features are not available on the high precision chrome on glass substrate, so the checkerboard is the optimal pattern for this test.
Using Sharpness to Measure Your Autofocus Consistency
Autofocus plays a major role in many camera system applications with variable focus, including consumer electronic devices. Camera systems must be able to focus at a variety of distances. Optical systems on cameras only allow a certain range of distances from the camera to be in focus at once (this is often known as the depth of field, or depth of focus).
Spilled Coins Cross Test Chart
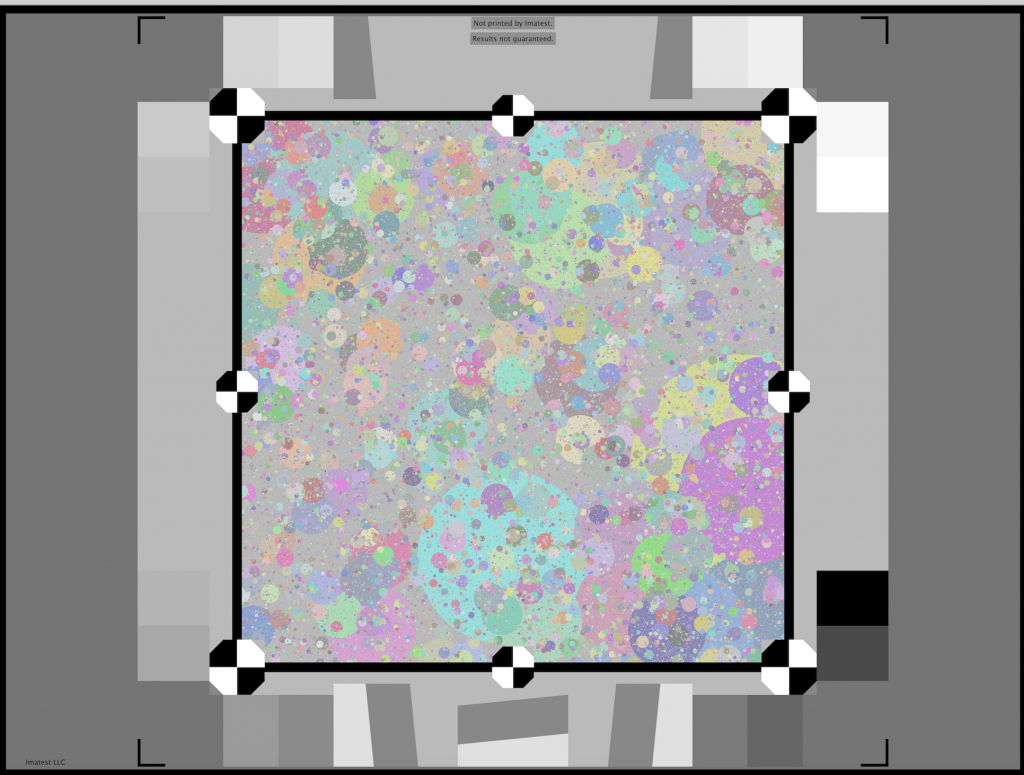
The updated Imatest Spilled Coins Cross test charts use cross-correlation calculation texture metrics to provide improved stability for images with nonlinear noise reduction. Users can now more accurately differentiate between noise and texture. Random/Dead Leaves Cross, which runs under the interactive Rescharts interface, measures SFR (Spatial Frequency Response) or MTF (Modulation Transfer Function) from random scale-invariant (or approximately scale-invariant) test charts, including “Dead Leaves” and “Spilled Coins” charts.
Long Range Testing
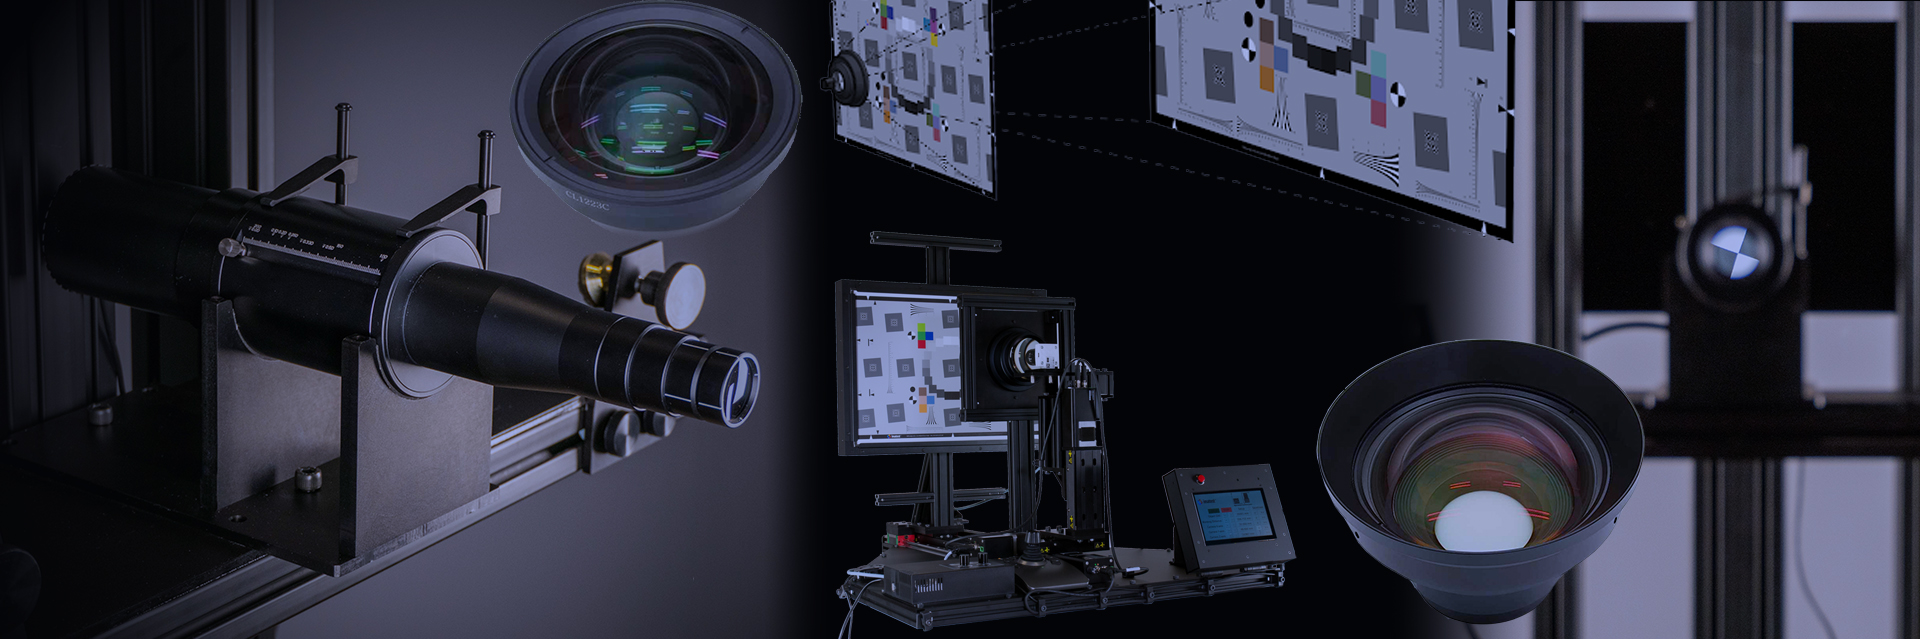
For lenses that focus out at long distances, to verify ability to focus on distant objects you will need a target system that produces an image that is at or beyond the hyperfocal distance of your lens. You can use our chartfinder utility to determine the size of your imaging plane at a distance based on your lens’ angular field of view. Jump to: Collimator Fixture | IMTS Target Projection | IBTS Stray Light/Target Projector Version | Projection Collimators | Multi-collimator systems | Physical Targets Virtual Target Projection Systems A collimator lens (also known as a close-up lens or relay lens) can change […]
Image Quality Factors
Image Quality Factors are also called Key Performance Indicators (KPIs). Sharpness Noise Dynamic-Range Color Accuracy Distortion Uniformity Chromatic Aberration Stray Light (Flare) Color Moiré Artifacts Compression Image Quality Factor Video Series Summary table— Image quality factors and corresponding test charts and modules Sharpness Noise Dynamic range, tone, & contrast Color accuracy Lens Distortion Uniformity Blemishes ISO Sensitivity Lateral Chromatic Aberration Stray Light (Flare) Color Moiré Artifacts Data compression losses Dmax Color gamut Texture Detail Overview of image quality and Imatest measurements Image quality is one […]
Artifacts
Noise reduction and sharpening Original | NR+Sharpening Software (especially operations performed during RAW conversion) can cause significant visual artifacts, including oversharpening “halos” and loss of fine, low-contrast detail. These artifacts result from nonlinear (nonuniform) signal processing (so-called because it varies with the signal). Images may be sharpened (MTF boosted) in the proximity of contrasty features like edges and blurred (lowpass filtered) in their absence. This generally improves measured performance (both sharpness from slanted-edges and noise/Signal-to-Noise Ratio (SNR) from chart patches), but it may result in a degradation of perceived image quality, for example, a “plasticy” cartoon-like appearance of skin even […]