Search Results for: MTF
Ultra-wide Camera Testing

Resolution Testing Fisheye (highly barrel-distorted) lenses can be effectively tested with several Imatest modules. SFRplus with pre-distorted test charts. If chart parameters are entered, distortion and Field of View (FoV) are calculated. eSFR ISO with pre-distorted test charts. Distortion and FoV are not currently calculated. Beyond around 160° it becomes increasingly difficult to fill the image plane with a planar test chart. We introduced SFRreg as a flexible target and analysis system for testing the resolution of ultra-wide cameras. (It can also be used for long-distance and depth of field testing) Example of an ultra-wide camera test setup: See […]
Lens Testing
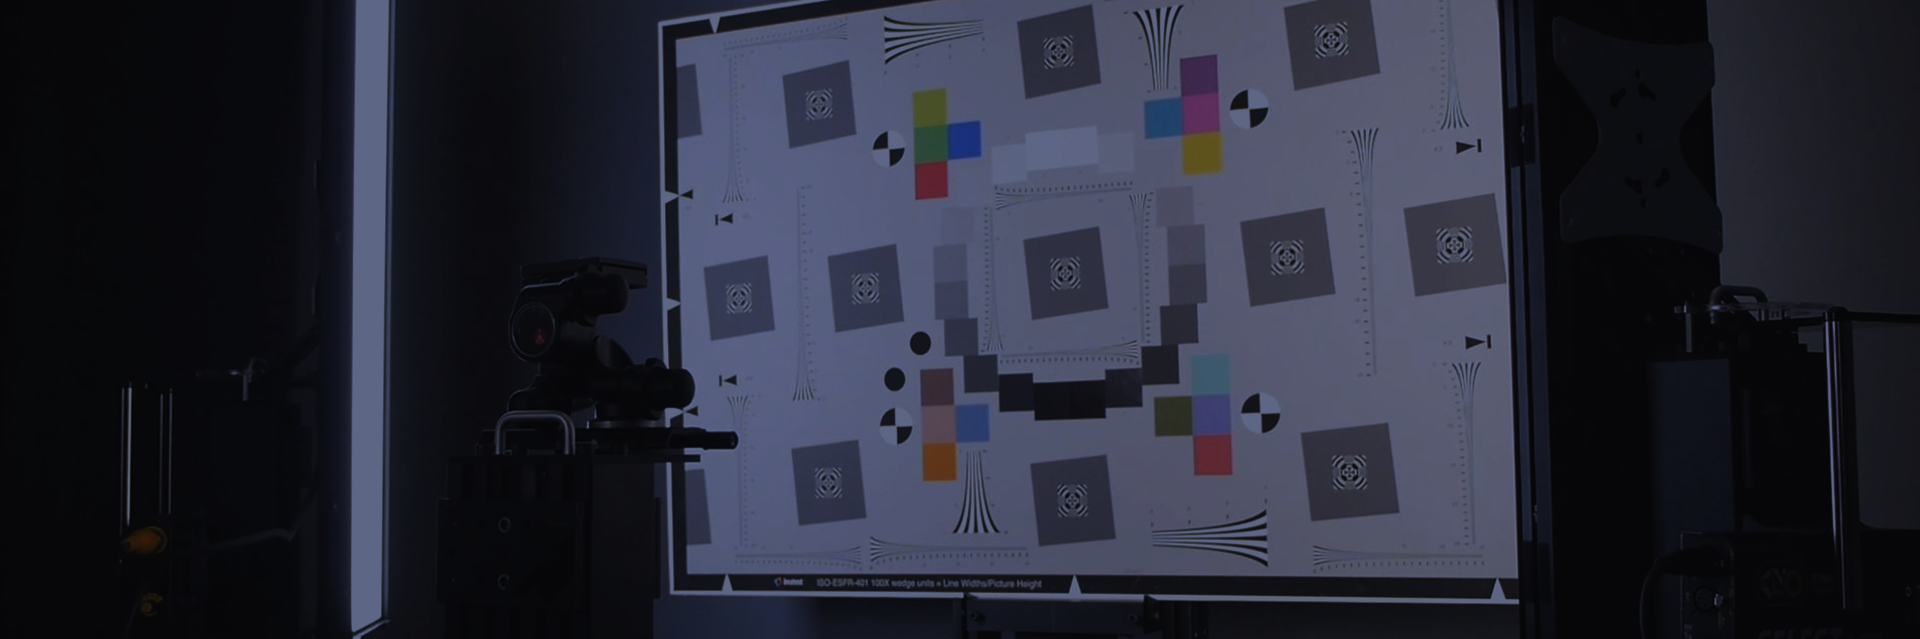
The quality of a camera lens determines how an image forms on a sensor. Lens quality is tested to verify the lens is designed, built, and focused correctly. Once a highly tedious process, Imatest has since refined the testing practice with several solutions, including highly accurate and specific test charts and fixtures. Testing Distance – Sharpness – Chromatic Aberration – Lens Flare Geometric Calibration – Relevant Standards – Supply Chain Image Quality Testing Distance To determine what size of test chart is needed, use the Imatest Chart Finder that can also calculate the imaging plane based on the sensor […]
ISO 15739 — Noise
Standard: ISO 15739:2017 — Photography — Electronic still-picture imaging— Noise measurements Technical Committee: ISO/TC 42 Photography Published: 2017-05 The Simplified ISO-15739 digital camera noise test chart is available from the Imatest Store. This chart can be analyzed by the Imatest Stepchart, Multicharts, and Multitest modules. Imatest 4.0+ includes a calculation of ISO 15739 visual noise as specified in Appendix B of the ISO 15739:2017 standard. And Imatest 4.4+ includes a calculation of visual noise from the IEEE CPIQ P1858 (Camera Phone Image Quality) 2016 specification, which is based on ISO 15739 with some added details. These are relatively complex […]
ISO 16505 — Camera Monitor Systems
Standard: ISO 16505:2015 Road vehicles — Ergonomic and performance aspects of Camera Monitor Systems — Requirements and test procedures. Technical Committee: ISO/TC 22/SC 35 Lighting and visibility Published: 2015-05-01 Test Targets ISO 16505 Test Targets are available for purchase on the Imatest Store. Test Methods Resolution References ISO 12233:2014. Hyperbolic wedge features can be analyzed by the Wedge or eSFR ISO module. Slanted edge features can be analyzed by the SFR, SFRplus, eSFR ISO, SFRreg, or Chekerboard modules. We presented a paper, “Measuring MTF with wedges: pitfalls and best practices” at the Multi-camera and Embedded Systems for Autonomous Machines […]
ISO 12233 — Resolution and SFR
eSFR ISO: Analyze the ISO 12233:2017 Edge SFR chart* and ISO 12233:2023 Edge SFR chart Standard: ISO 12233:2017 — Photography— Electronic still picture imaging — Resolution and spatial frequency responses* ISO 12233:2023 — Photography— Electronic still picture imaging — Resolution and spatial frequency responses Technical Committee: ISO/TC 42 Photography Published: 2017-01, 2023-02
Dynamic Range
Dynamic Range (DR) is the range of exposure, i.e., scene brightness, over which a camera responds with good contrast and good Signal-to-Noise Ratio (SNR). This is a scene-dependent image quality factor that incorporates sensor sensitivity, noise, and stray light. High Dynamic Range (HDR) scenes have a ratio between light and dark areas that exceeds 10,000:1 (80dB; 4.0 Optical Density; 13.3 f-stops). See below for how to achieve HDR imaging. Some examples of HDR Scenes: Mixed indoor/outdoor scene. Entering or exiting a tunnel or parking garage, A door or window open to the brightly lit outdoors, a shadowed area cast by […]
Imatest IT Test Items & Modules
The Test Items below are oriented towards manufacturing and quality control. The Imatest Module list shows each relevant output. “X” indicates optimal support for the test item and “/” indicates sub-optimal support. Sharpness Modules Test Item SFRplus eSFR ISO SFR SFRreg Random Log-f Contrast Wedge Star Sharpness (MTF) X X X X X X X X Limiting Resolution X X Lateral Chromatic Aberration X X X X Distortion X / Field of View X X Tilt X […]
SFRplus Target on Chrome on Glass
This chart is produced with the highest precision process we have available. For more detailed information on the various processes by which we create our targets, please take a look at our Transmissive Chart Quality Comparison.
Chrome on Glass charts are uni-tone, have 10:1 contrast, and do not include a step-chart. This means that they do not support calculation of tonal response curves. The star pattern is strictly for use as a focusing aid, and is not intended as a testing feature (i.e., as a star chart).
- Lead Time: 4″ Plate or Smaller – 2 Weeks (MoQ – 1 Unit)
- Lead Time: 5″ Plate or Larger – 4-8 Weeks (MoQ 2 to 3 Units, size dependent)
Sinusoidal Siemens Star Target
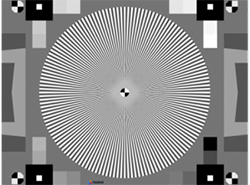
The Sinusoidal Siemens Star test chart allows you to measure MTF and limiting resolution with a chart that provides angular response and may be less affected by signal processing (especially sharpening) than slanted-edges. Siemens star MTF20 (the spatial frequency where MTF is 20% of its low frequency value) is a good estimate of limiting resolution.
Sinusoidal Siemens Star
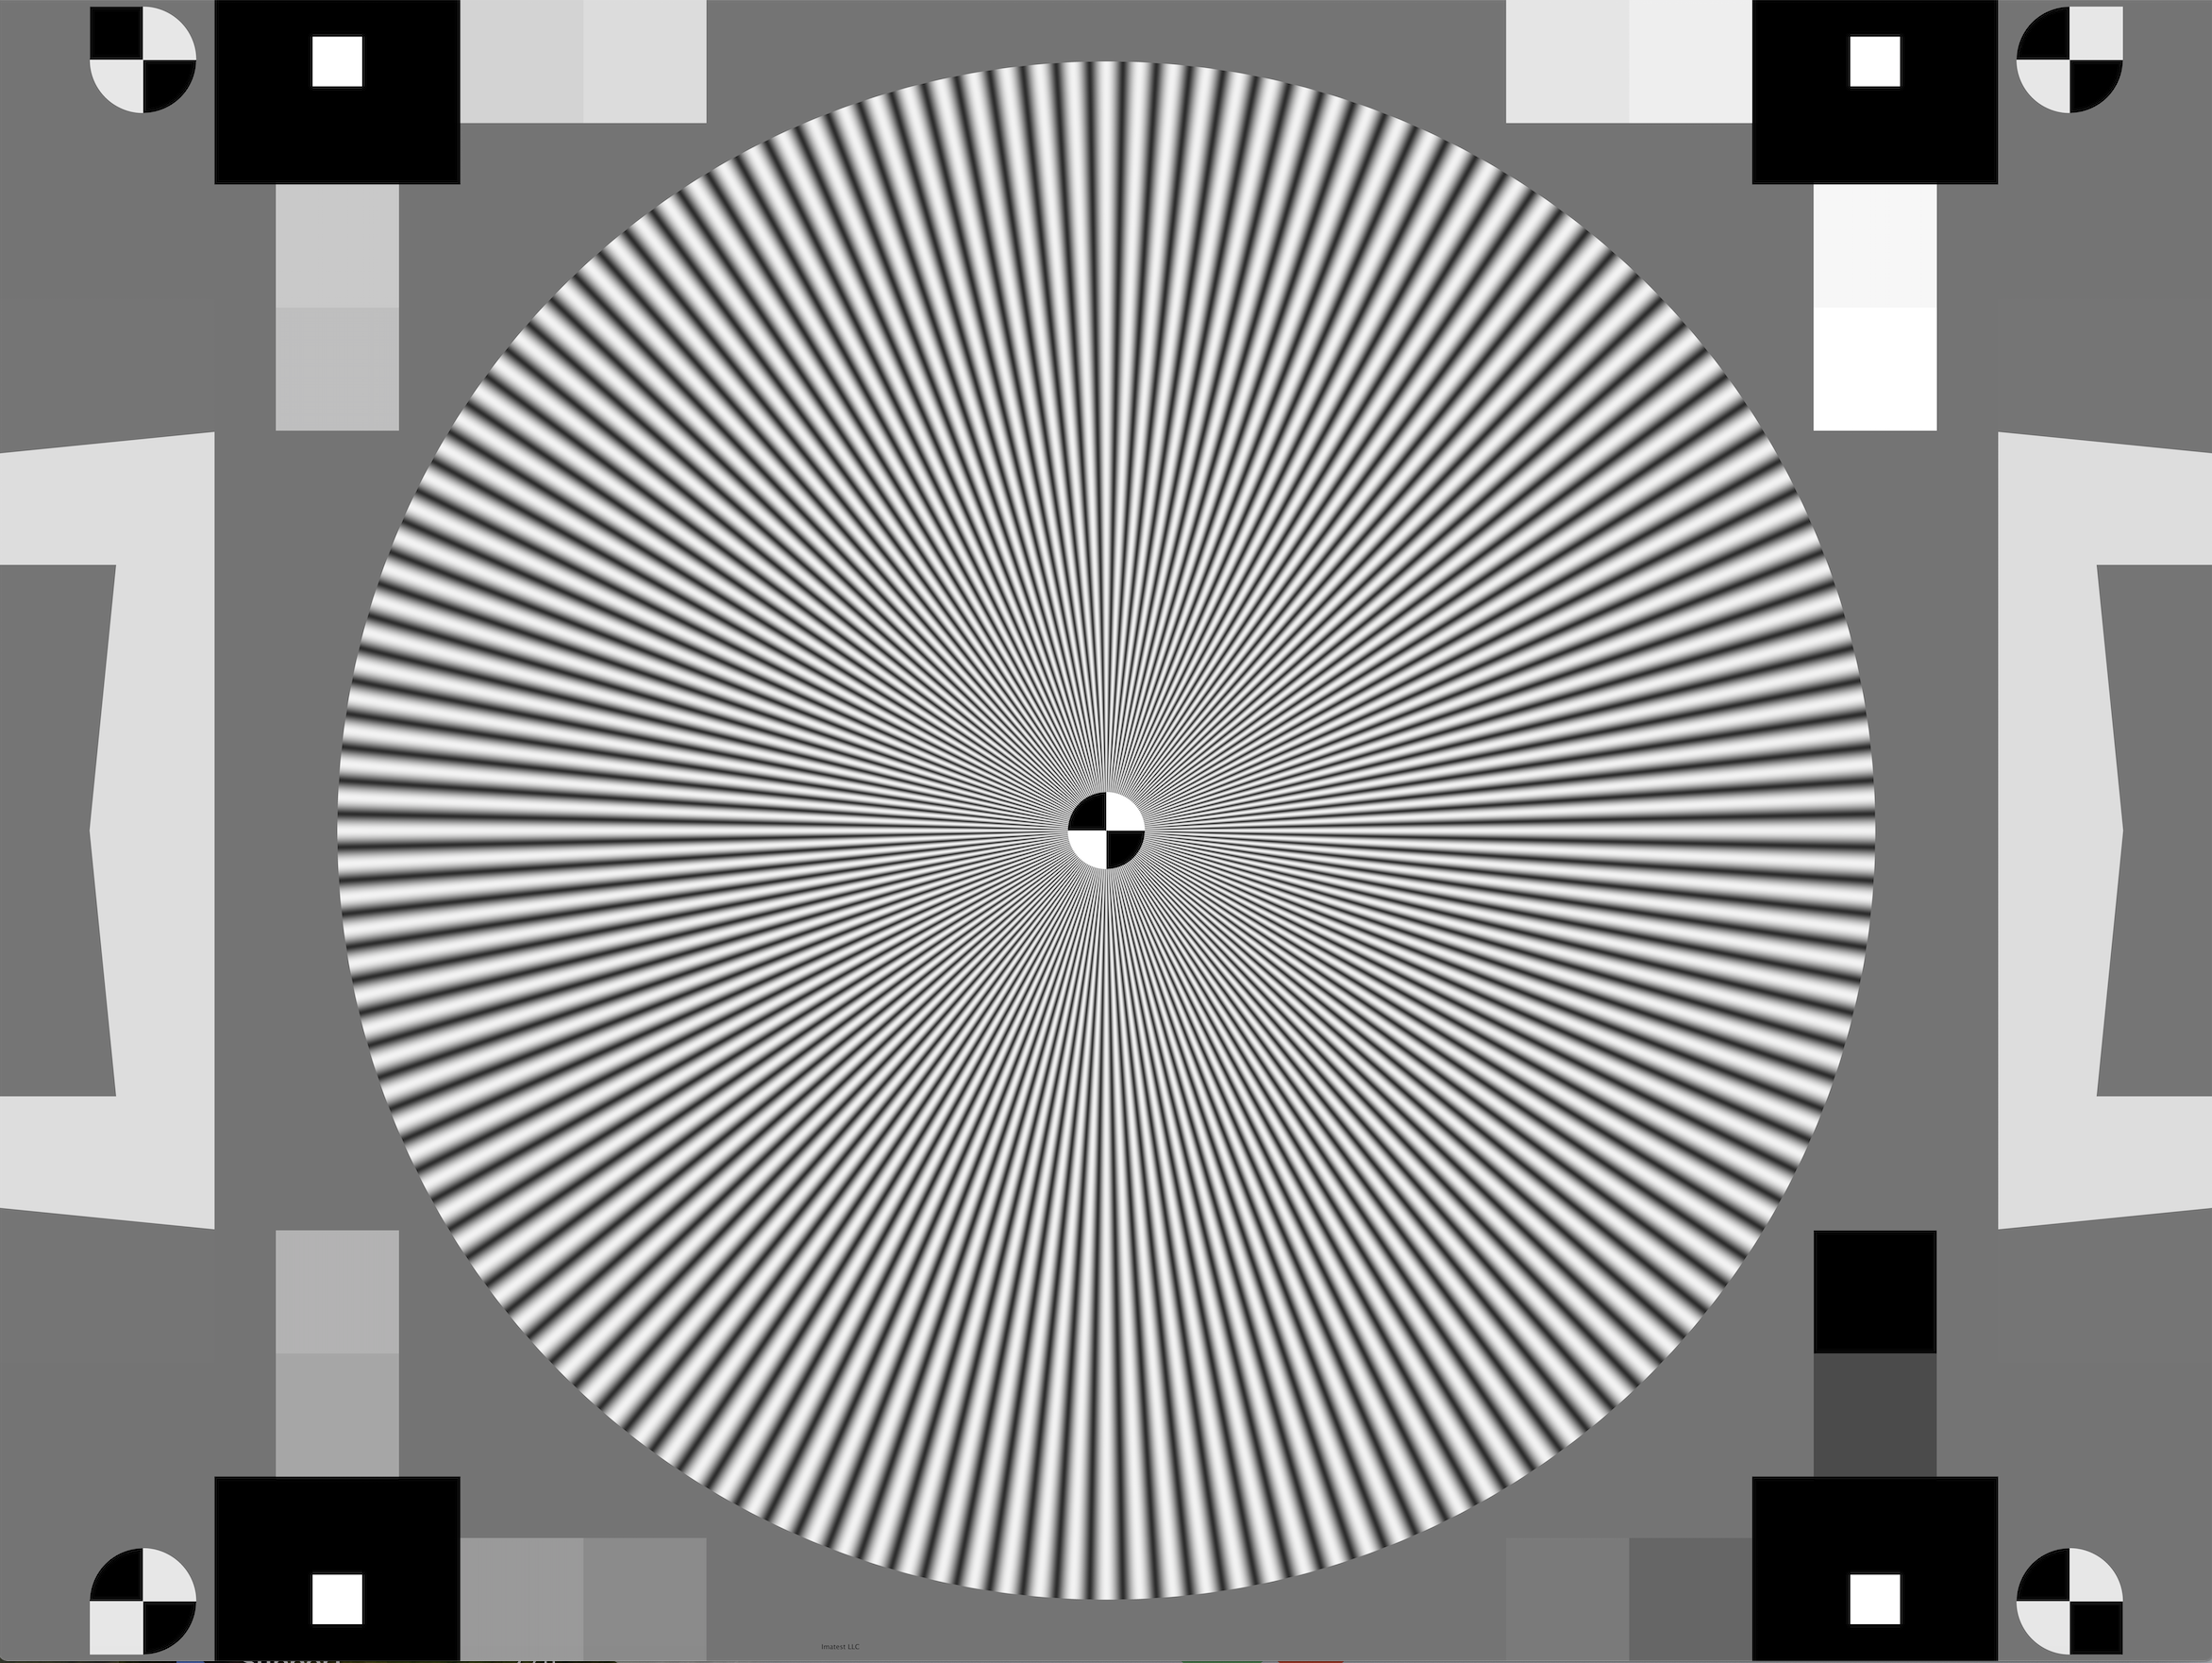
The Sinusoidal Siemens Star target is consistent with the ISO12233:2014 standard. It is printed on matte paper. The modulation of the radial sinusoidal patern is close to a 50:1 contrast ratio.
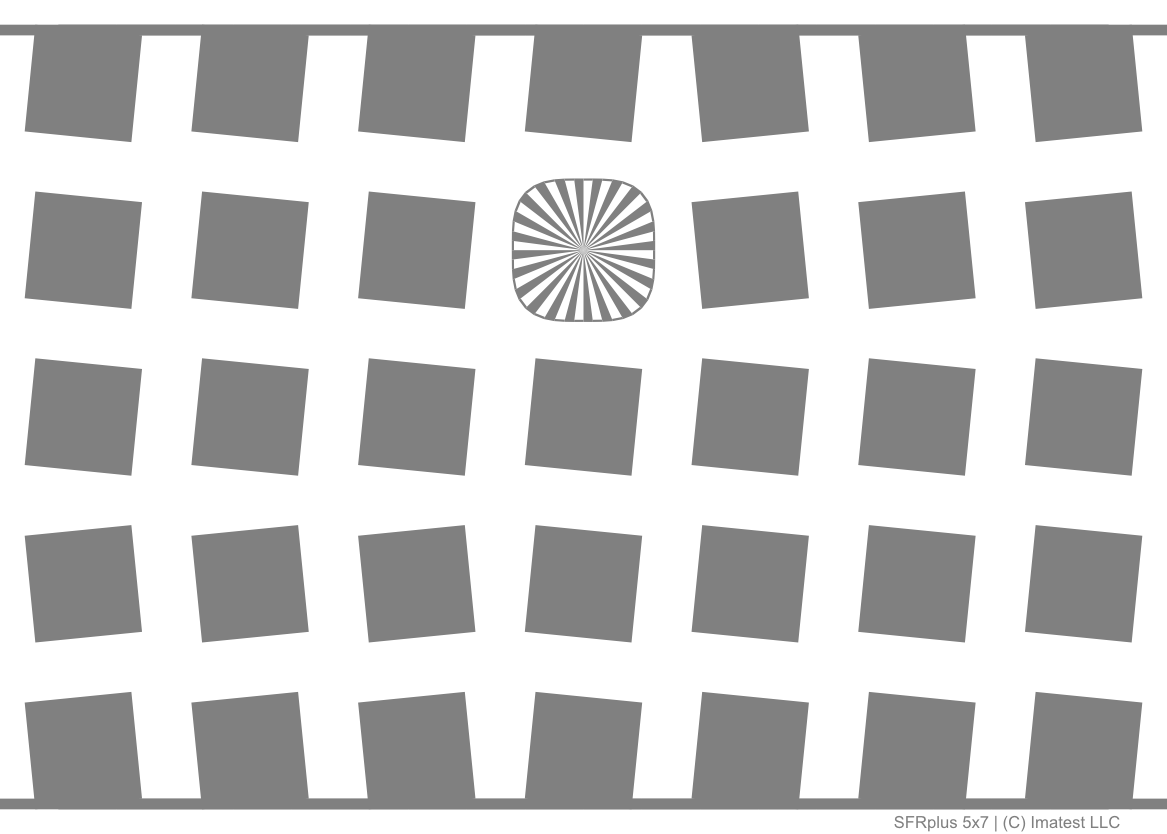
SFRreg Target

The SFRreg test target consists of a slanted-edge quadrant pattern enclosed within a circle. It is used for measuring MTF and lateral chromatic aberration. A test image typically contains several targets that are automatically detected and analyzed by Imatest 4.2.
High Dynamic Range Target, ITI LED Lightbox
We are pleased to announce our new High Dynamic Range (HDR) test chart with a density range exceeding 120dB (optical density >6.0). This chart allows you to the measure the dynamic range, tonal response and noise of HDR cameras with a single image instead of multiple, exposure bracketed images. It also contains slanted edges for MTF measurements.
Lightbox Comparison Guide
Lightbox Brightness Uniformity* CRI (spec.) Viewing Area Dimensions Controls ITI LED Lightbox 30 – 10,000 Lux 95.2% Over 97 260 mm x 220 mm 400 (W) x 380 (H) x 100mm (D) Bluetooth, USB IQL LED Lightbox 10 – 40,000 Lux 254mm x 279.4mm 472.4 x 383.5 x 129.5mm Wireless via Android GL-16e Lightbox Viewer 5750 Lux 63.6% 96-98 10 x 18″ (25 x 46 cm) 15x25x5″ (38x64x13cm) Manual GL-20e Lightbox Viewer GL-30e Lightbox Viewer GL-44e Lightbox Viewer GLX-3044 […]