$350.00 – $600.00
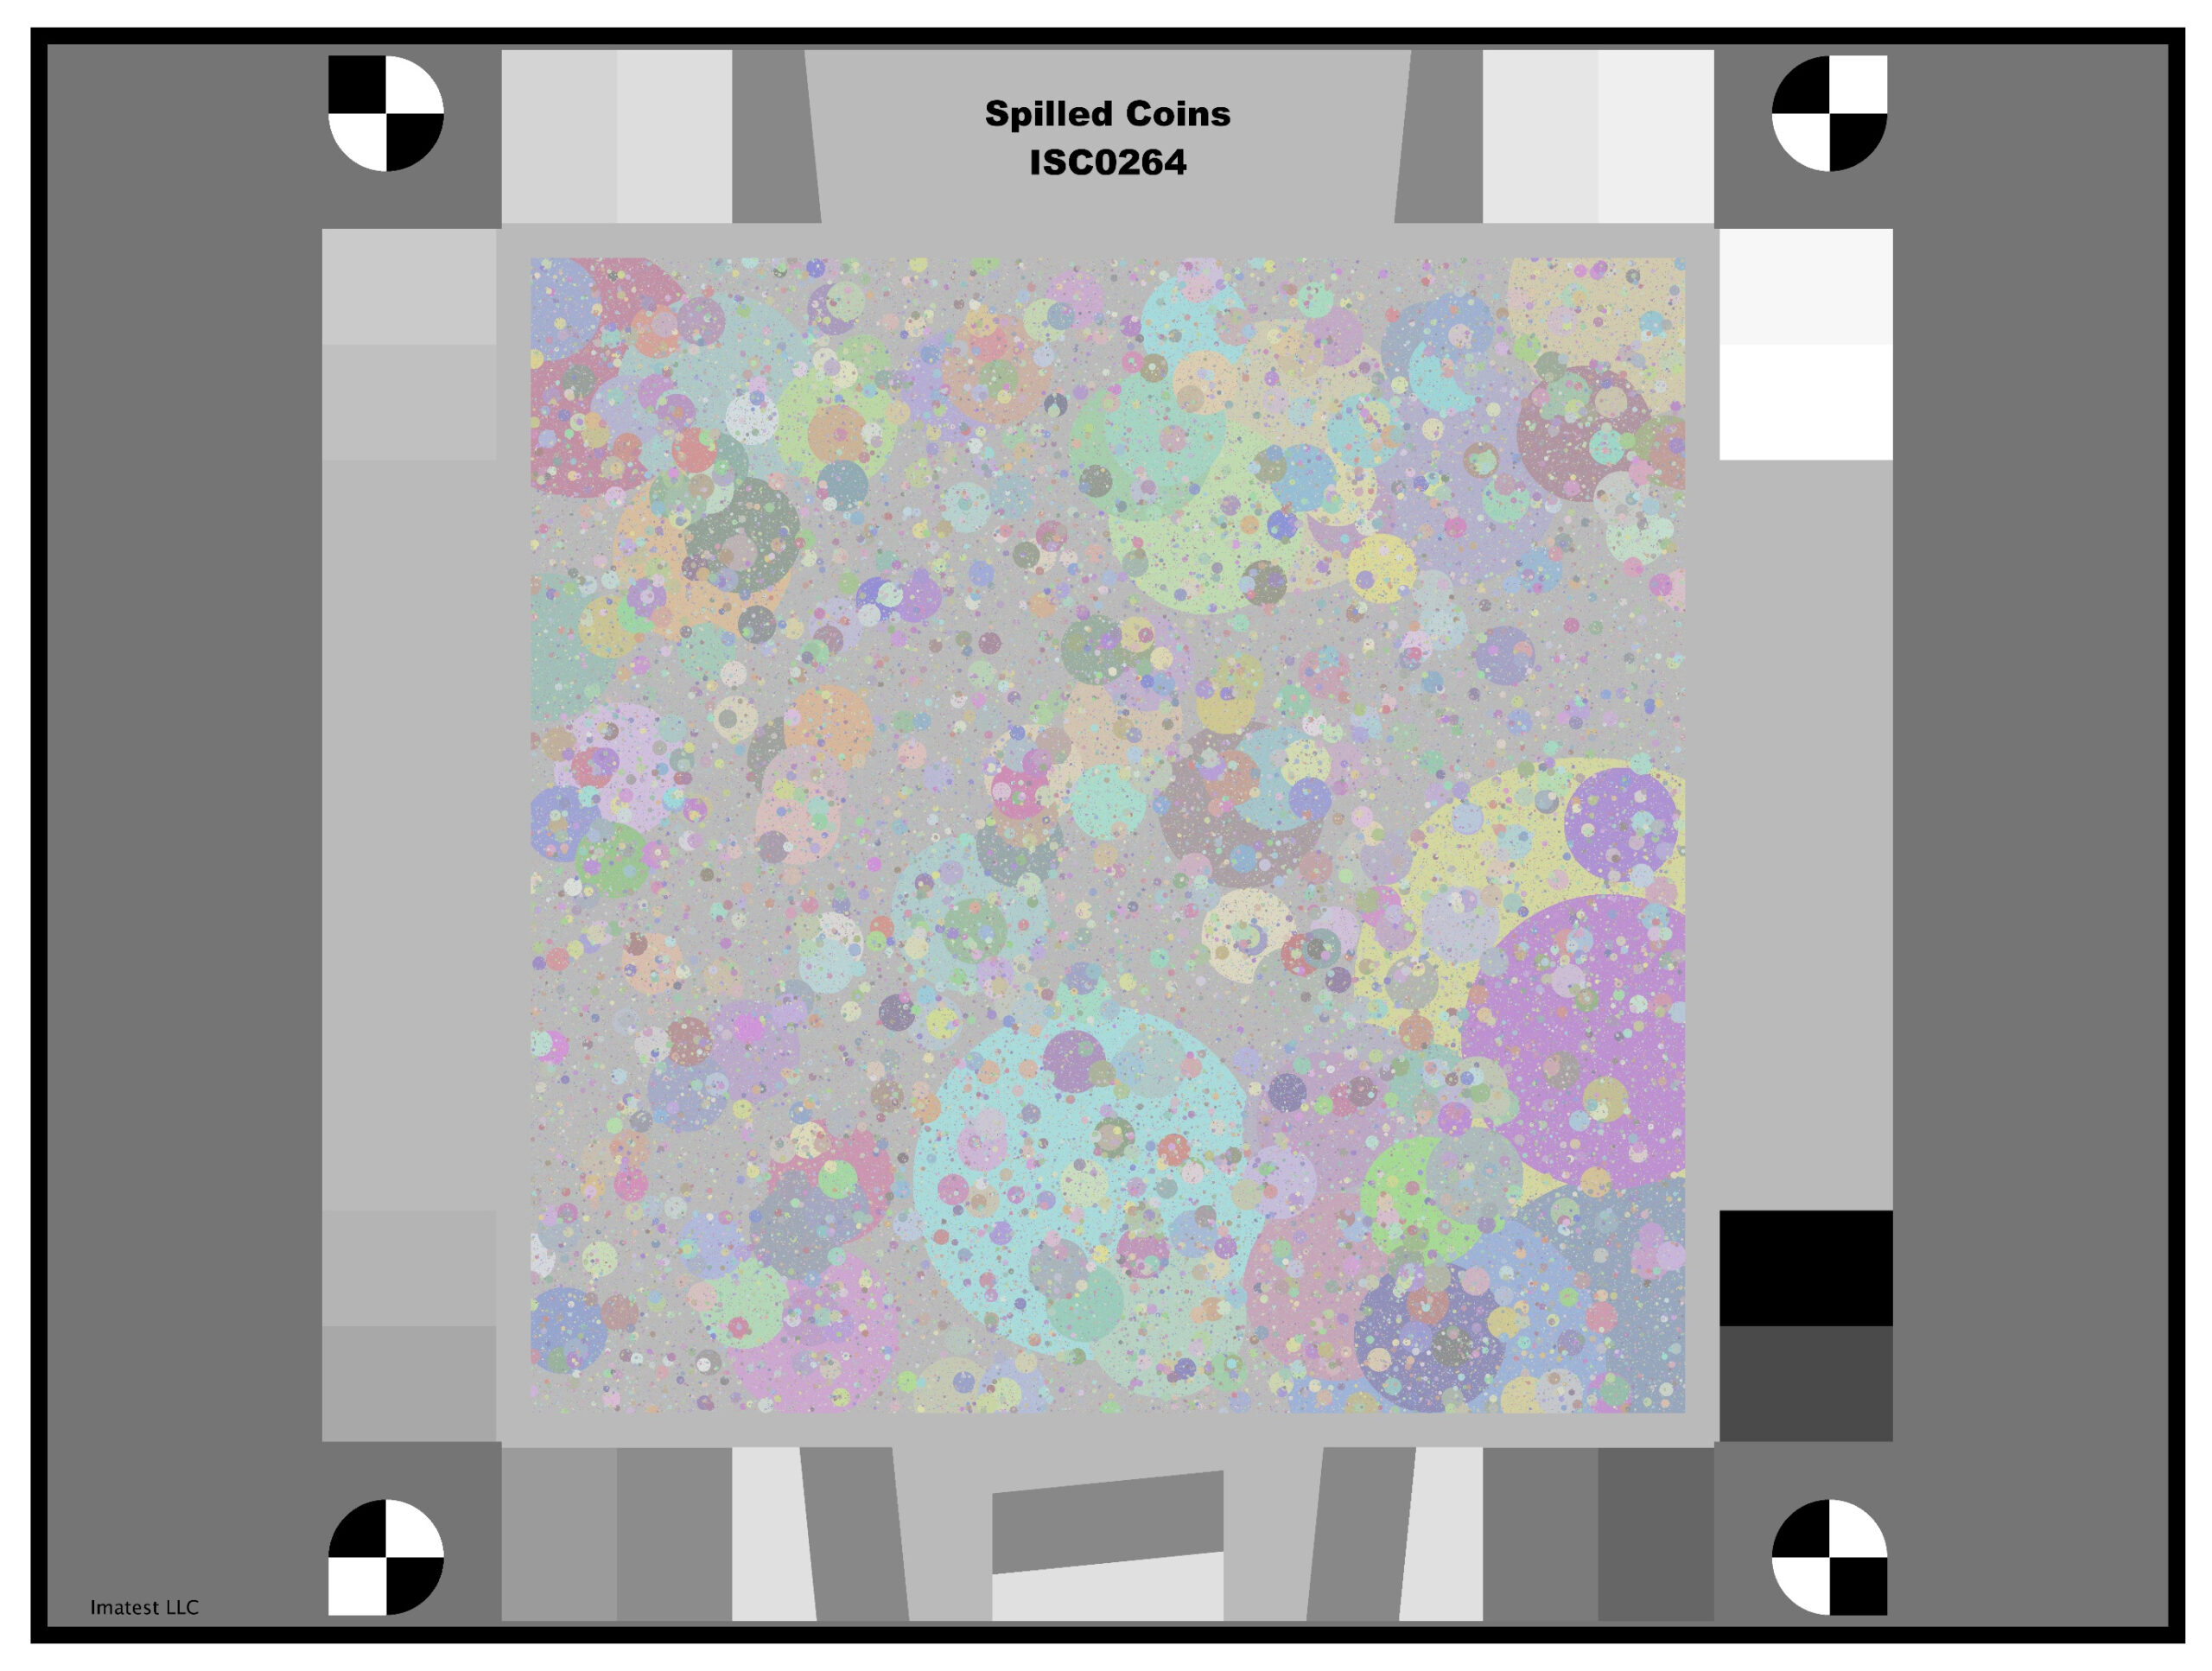
The Color Imatest Spilled Coins chart is a variant of the Dead Leaves chart designed to measure texture sharpness. It has several advantages over older Dead Leaves charts, including nearly perfect scale-invariance, which improves the accuracy and robustness of measurements, and gray regions to the left and right of the chart that facilitate noise removal (using a technique where gray patch noise Power Spectral Density is subtracted from the signal + noise PSD of the central Spilled coins region).
Read more about Random/Dead Leaves chart analysis in the Imatest documentation.
Description
The Color Imatest Spilled Coins chart (a variant of the Dead Leaves chart) for measuring texture sharpness has several advantages over older Dead Leaves charts. Key features:
- The Scattered Coins pattern in the central region is almost perfectly scale-invariant (unlike conventional dead leaves charts), enhancing the accuracy and robustness of MTF measurements so they correlate well with other methods (such as the slanted-edge) for RAW images (which have no nonuniform or nonlinear processing).
- Maximum contrast range is 3:1, as called for in the CPIQ Phase 3 draft Texture Blur Metric draft specification.
- It is more uniform, i.e., is more shift-invariant than other Dead Leaves charts.
- It contains slanted edges (2:1 and 4:1 contrast) for convenient comparisons with the dead leaves pattern.
- The gray area to the left and right of the dead leaves pattern has the same mean density as the dead leaves pattern, allowing it to be used for effective noise PSD removal using the McElvain et. al. technique.
- Registration marks and 16 grayscale patches are included. The linear levels used to create the grayscale patches are 0 through 255 in steps of 17 (same as the Siemens Star chart in the draft of the upcoming ISO 12233 standard).
| Spilled Coins chart sizes | Spilled Coins region | Printed region | Media size total |
|---|---|---|---|
| Large | 12″ × 12″ (305mm × 305mm) |
22.4″ × 16.8″ (569mm × 426mm) |
22.9″ × 17.3″ (582mm × 439mm) |
| Medium | 8″ × 8″ (203mm × 203mm) |
14.93″ × 11.2″ (379mm × 284mm) |
15.43″ × 11.7″ (392mm × 297mm) |
| Small | 6″ × 6″ (152mm × 152mm) |
11.2″ × 8.4″ (284mm × 213mm) |
11.7″ × 8.9″ (297mm × 226mm) |
| X-Small (High Precision Transmissive) | 5.536″ × 5.536″ 141 mm × 141 mm |
9.25″ × 7.75″ 159 mm × 197 mm |
10″ × 8″ 254 mm × 203 mm |
Read more about Random/Dead Leaves chart analysis in the Imatest documentation.
You may also like…
-

Spilled Coins Charts for Imatest LED Light Sources
$630.00 – $1,920.00Select options This product has multiple variants. The options may be chosen on the product page


