$770.00 – $1,420.00
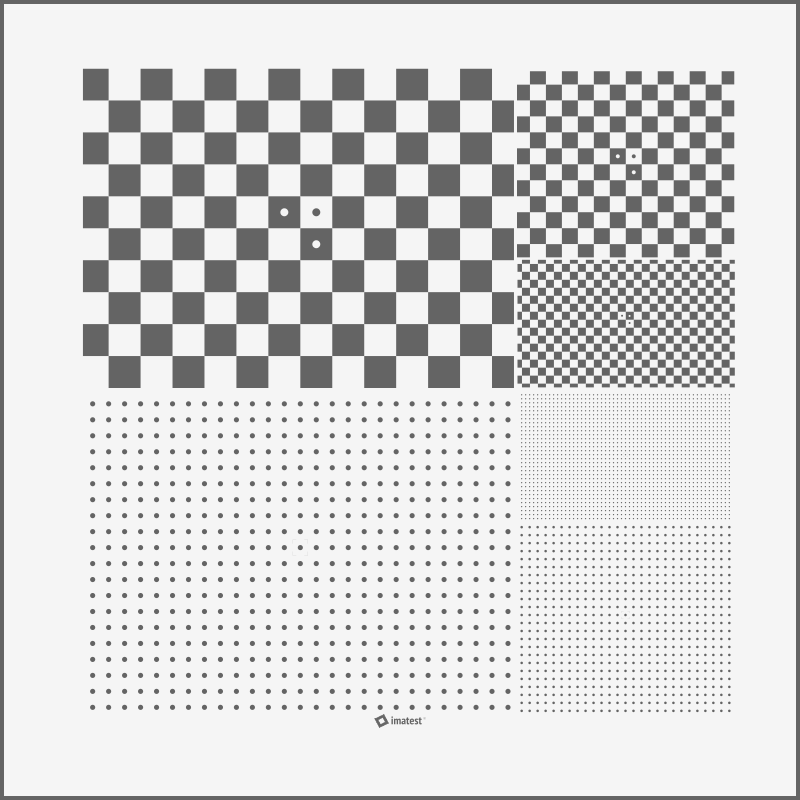
A glass target produced with low-density chrome at a 10:1 contrast ratio. This high precision test chart allows testing of high-resolution close range cameras at multiple object distances and enables the precise measurement of sharpness, distortion and chromatic aberration.
Multiple measurement areas, with a size ratio of 2:1, enables testing at a wide range of close distances while being able to fill your field of view with testable chart area. This chart is available in two sizes: 100mm (4″) square or 25 x 75mm (1×3″)
For ease of placement and removal, options include an acrylic frame sized for Imatest LED Lightboxes size B through D and Light Panels size A through D.
While this chart should be able to cover a large range of use cases, please contact charts@imatest.com for different sizing or design customization.
Description
4″ Square: Checkerboard Charts
|
Frequency Zone |
Square Size |
Dimensions |
Distortion Crossing Points HxV |
|---|---|---|---|
|
Low |
4.000 mm |
54.2 x 40.0 mm |
13 x 9 |
|
Medium |
2.000 mm |
27.2 x 23.3 mm |
13 x 11 |
|
High |
1.000 mm |
27.2 x 16 mm |
27 x 16 |
4″ Square: Dot Pattern Charts
|
Frequency Zone |
Dot Spacing |
Dot Diameter |
Dimensions |
Dots HxV |
|---|---|---|---|---|
|
Low |
2.000 mm |
0.640 mm |
54.2 x 40.0 mm |
27 X 20 |
|
Medium |
1.000 mm |
0.320 mm |
27.2 x 23.3 mm |
27 X 24 |
|
High |
0.500 mm |
0.160 mm |
27.2 x 16 mm |
32 x 53 |
1 x 3″ Slide: Checkerboard Charts
|
Frequency Zone |
Square Size |
Dimensions |
Distortion Crossing Points HxV |
|---|---|---|---|
|
Low |
1.078 mm |
14.5 x 10.8 mm |
13 x 9 |
|
Medium |
0.539 mm |
7.3 x 6.3 mm |
13 x 11 |
|
High |
0.269 mm |
7.3 x 4.3 mm |
27 x 16 |
1 x 3″ Slide: Dot Pattern Charts
|
Frequency Zone |
Dot Spacing |
Dot Diameter |
Dimensions |
Dots HxV |
|---|---|---|---|---|
|
Low |
0.539 mm |
0.172 mm |
14.2 x 10.4 mm |
27 x 20 |
|
Medium |
0.269 mm |
0.086 mm |
7.1 x 6.3 mm |
27 x 24 |
|
High |
0.135 mm |
0.043 mm |
7.1 x 4.2 mm |
32 x 53 |
 Testing Images With Imatest
For an example of a macro lens test with this target, see Testing a macro lens using Checkerboard and Micro Multi-slide.
Using Imatest 4.5, the checkerboard region can be analyzed using the Checkerboard module. The dot pattern analysis module has been available since 2011 Release 3.8.
For older versions of Imatest, you can use the distortion module to calculate distortion from the checkerboard, but this is not as resistant to fisheye distortion as what is available with the Checkerboard module of Imatest 4.5.
Documentation and software support
Checkerboard can be run either through the highly-interactive Rescharts interface or as a batch-capable fixed module. The key documentation for getting started is Using Checkerboard Part 1, found in the Checkerboard section of the Documentation page. Checkerboard provides the most accurate distortion measurements.
Dot pattern (fixed module-only) is also useful for distortion measurements: it’s included in several standards. See Dot Pattern.


