In January 2013 Imatest released the Spilled Coins test chart, which is an improved version of the Dead Leaves chart for measuring a camera’s fine texture response. (It’s available in the Imatest Store in both monochrome and color versions.) Shortly afterwards, Jason Cope of our partner company Image Quality Labs found an anomalous result and called me to find out what was wrong. When I looked at the image I realized that he’d done the test correctly. He had found an image whose processing defeated the intent of the dead leaves chart, which is to accurately measure a camera’s texture response without being fooled by processing tricks or signal artifacts.
The good news is that we’ve found ways of testing the image using a slanted-edge or Log F-Contrast chart that give an indication of the validity of the Spilled Coins measurements. If a camera flunks these tests, the Spilled Coins results can be ignored.
Crops of two 8-megapixel camera phone images taken in relatively dim (25 lux) and bright (900 lux) light are shown below. The images are from a screen shot from FastStone viewer, set to compare two images.
| iPhone 5: sharp with relatively little signal processing, but high noise |
Phone B: strongly sharpened near contrasty edges; strong noise reduction elsewhere |
Here is a similarly-scaled crop of the original pattern. Much more detail is visible.
 Original image for comparison, scaled to about the same size
The iPhone 5 is noisier but clearly preserves more texture. Phone B completely obliterates low contrast texture. Yet the measured MTF for the Spilled Coins pattern is nearly as good as the iPhone at high spatial frequencies (both below). Clearly something is wrong, and it’s not difficult to see what it is: Sharpening artifacts near the higher contrast boundaries in Phone B have high frequency energy that effectively boosts the measured MTF.
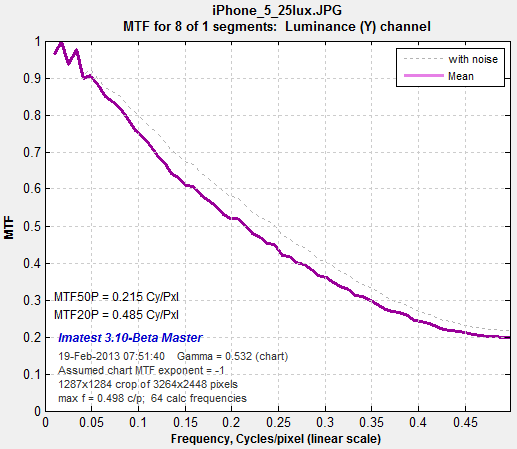 Spilled Coins MTF for the iPhone 5 at 25 lux. Spilled Coins MTF for the iPhone 5 at 25 lux.No obvious sharpening. |
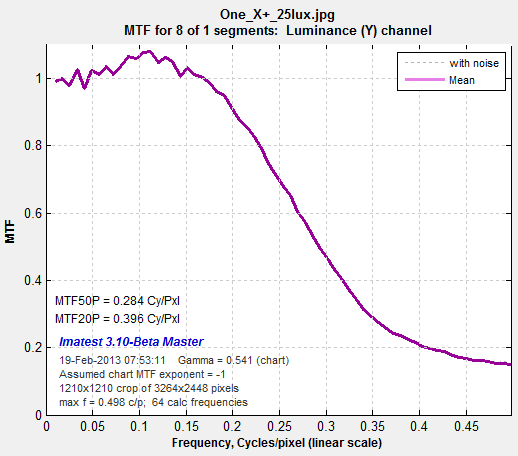 Spilled Coins MTF for Phone B at 25 lux. Spilled Coins MTF for Phone B at 25 lux.Significant sharpening is evident |
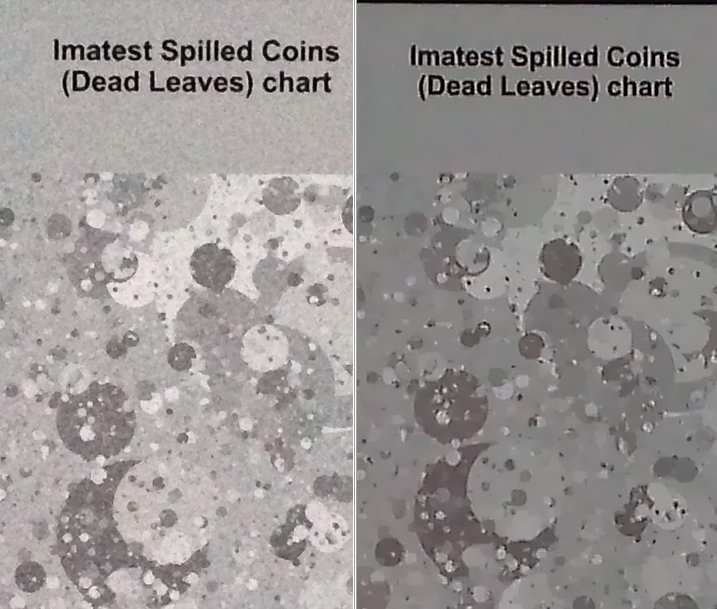
Here are the same two cameras at a higher light level (900 lux).
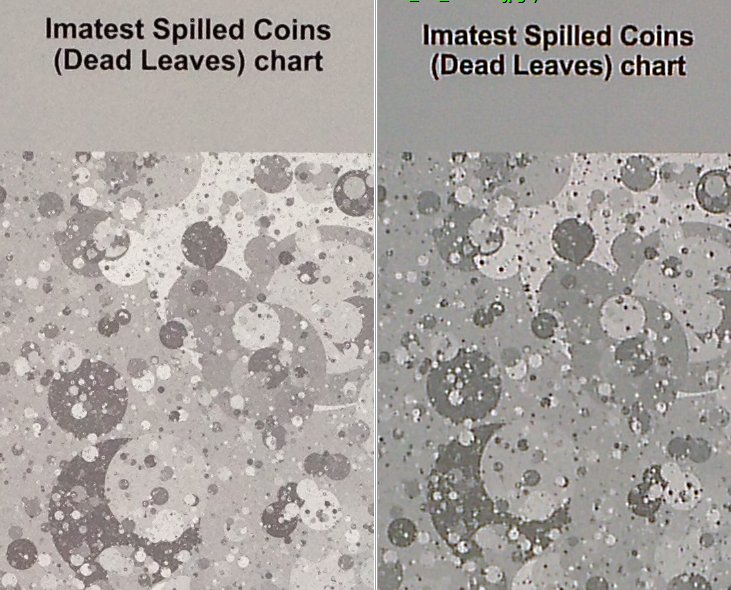 iPhone 5 (left) and Phone B (right), both taken at 900 lux (bright light); both 8 megapixels)
compared using FastStone viewer. Phone B still shows some texture loss.
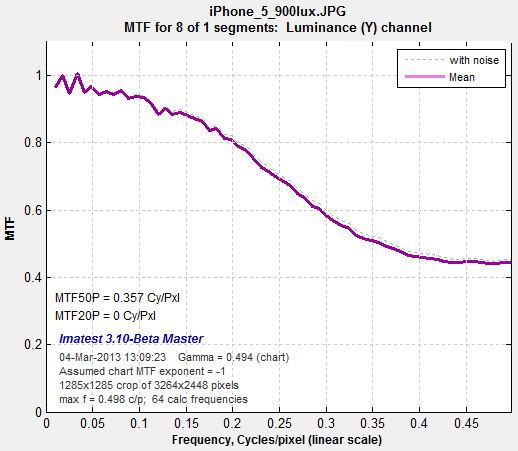
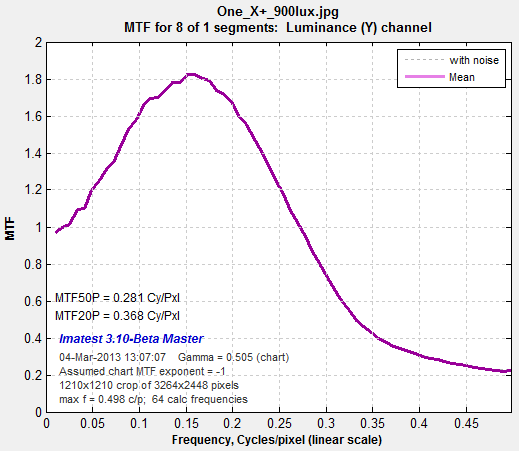
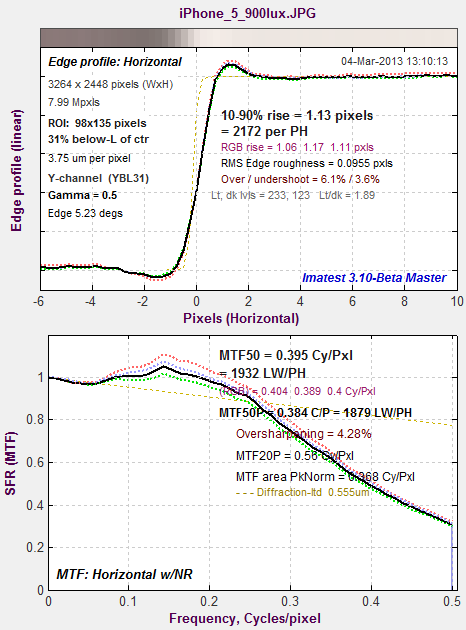
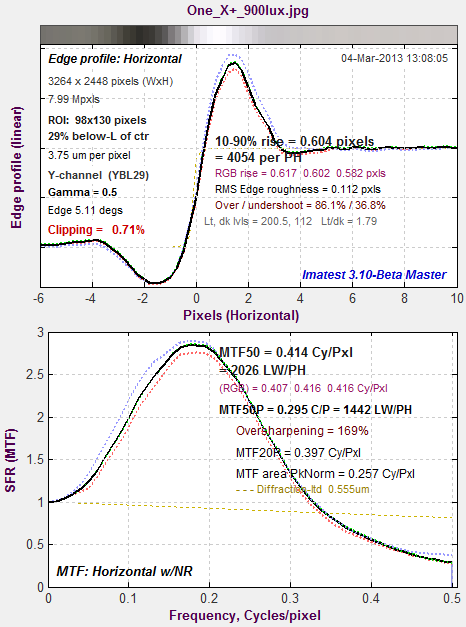
Here are the MTF results for the Spilled Coins pattern (upper) and slanted-edge pattern (lower) for these cameras. Phone B shows extreme sharpening. It might look good on the tiny screen of a camera, but the “halos” would be glaringly obvious (and ugly) with even moderate enlargement.The extreme MTF sharpening boost (1.8 for the Spilled coins and 2.8 for the slanted-edge) would be sufficient cause to fail this phone in a test.
Log F-Contrast results (comparison with Spilled Coins)
It’s useful to compare Spilled Coins and slanted-edge results with images of the Log F-Contrast chart for the same phones and illumination. The Log F-Contrast chart varies in spatial frequency across the chart and varies in modulation (contrast) from top to bottom. The displays show MTF contours as a function of contrast (or modulation).
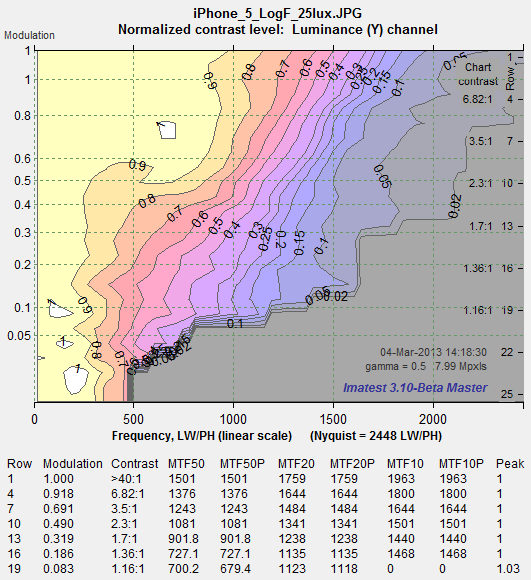 Results for the iPhone 5 at 25 lux. Results for the iPhone 5 at 25 lux.A weak sharpening peak is visible. Response is much more extended than for Phone B. |
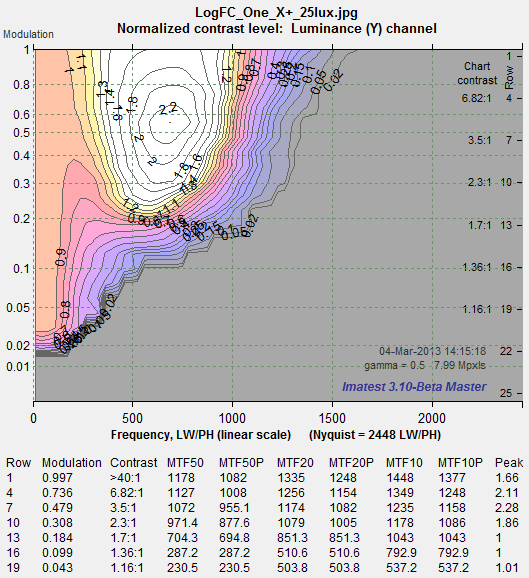 Results for Phone B at 25 lux. Sharpening is strong, Results for Phone B at 25 lux. Sharpening is strong,peaking at > 2.2, but response drops drastically for modulation < 0.15 (contrast ratio < 1.6:1). |
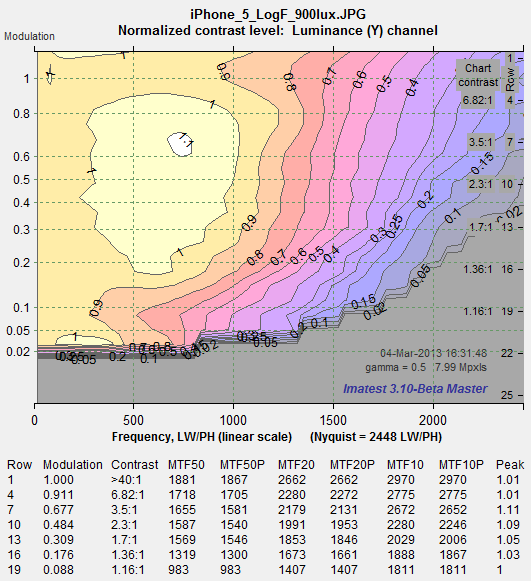 Results for the iPhone 5 at 900 lux. Results for the iPhone 5 at 900 lux.A weak sharpening peak is visible. |
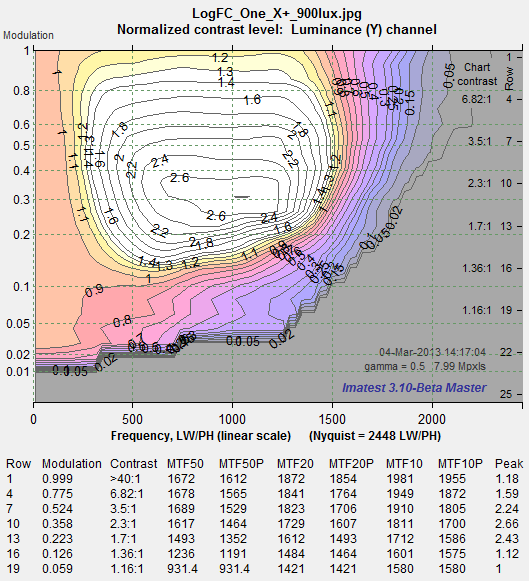 Results for Phone B at 900 lux. Sharpening is extreme, peaking at > 2.6. |
Key observations:
- Phone B has really large sharpening peaks: about as large for the Log F-Contrast chart as for the slanted-edges. The peak level appears to be lower at high contrast because the image is saturating.
- Phone B response drops off much more rapidly for low contrast levels, especially for low illumination (25 lux).
- The texture problem is plainly visible with the Spilled Coins chart, but it doesn’t slow up in the standard MTF (Fourier) analysis. This suggests that there may be other ways to analyze the Spilled Coins chart: an amplitude histogram, perhaps? Stay tuned.
- Both the slanted edge and the Log F-Contrast charts indicate problems that aren’t apparent in the Dead Leaves/Spilled Coins analysis.


