Current Documentation
Analyses & Output – INI settings – Chart Definition Files – Chart Definition Utility – Video Analysis
Overview
Starting in 23.1, Arbitrary Charts video analysis is supported in Imatest Master. Supported video files can be loaded into the Arbitrary Charts module to perform batch processing of individual frames or analysis of a single, signal averaged image. For batch processing of individual frames, a video analysis results JSON file containing auto exposure measurements will be output. A sample video and chart definition file can be downloaded from the Imatest Charts repository on GitHub.
Workflow
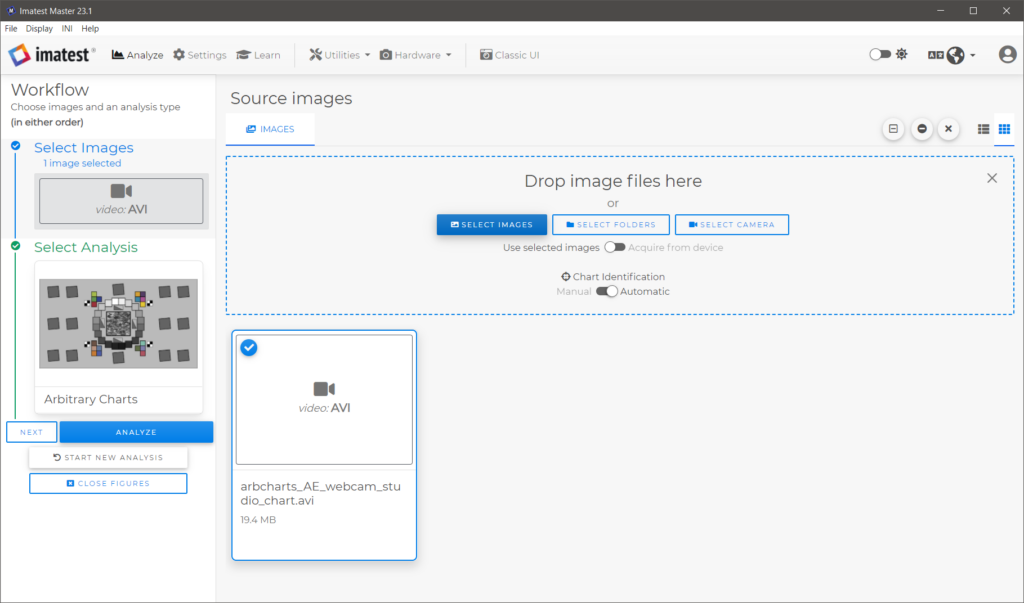
1. Load a video into Imatest Master then choose Arbitrary Charts analysis.

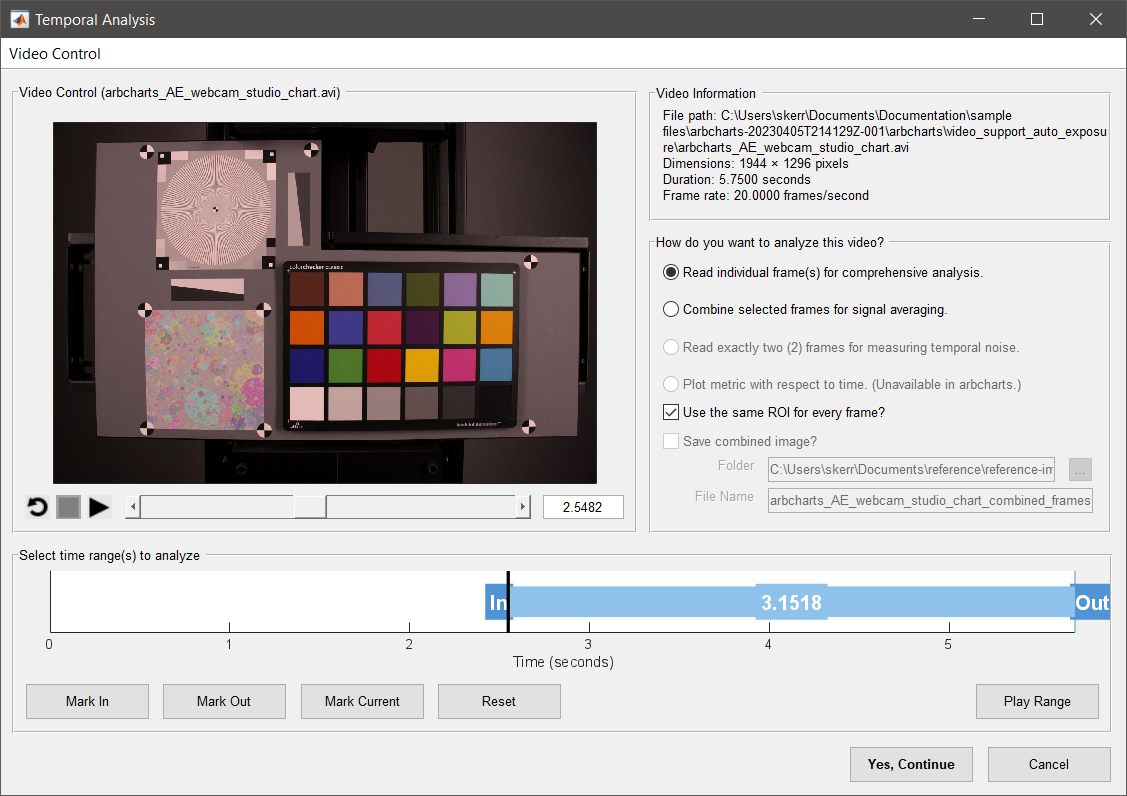
2. For auto exposure analysis, choose Read individual frame(s) for comprehensive analysis then specify the beginning and end points for analysis with the Mark In and Mark Out buttons. Click Yes, Continue to return to the Arbitrary Charts window. The first frame corresponding to the video “In Point” will be displayed in the Arbitrary Charts analysis window.

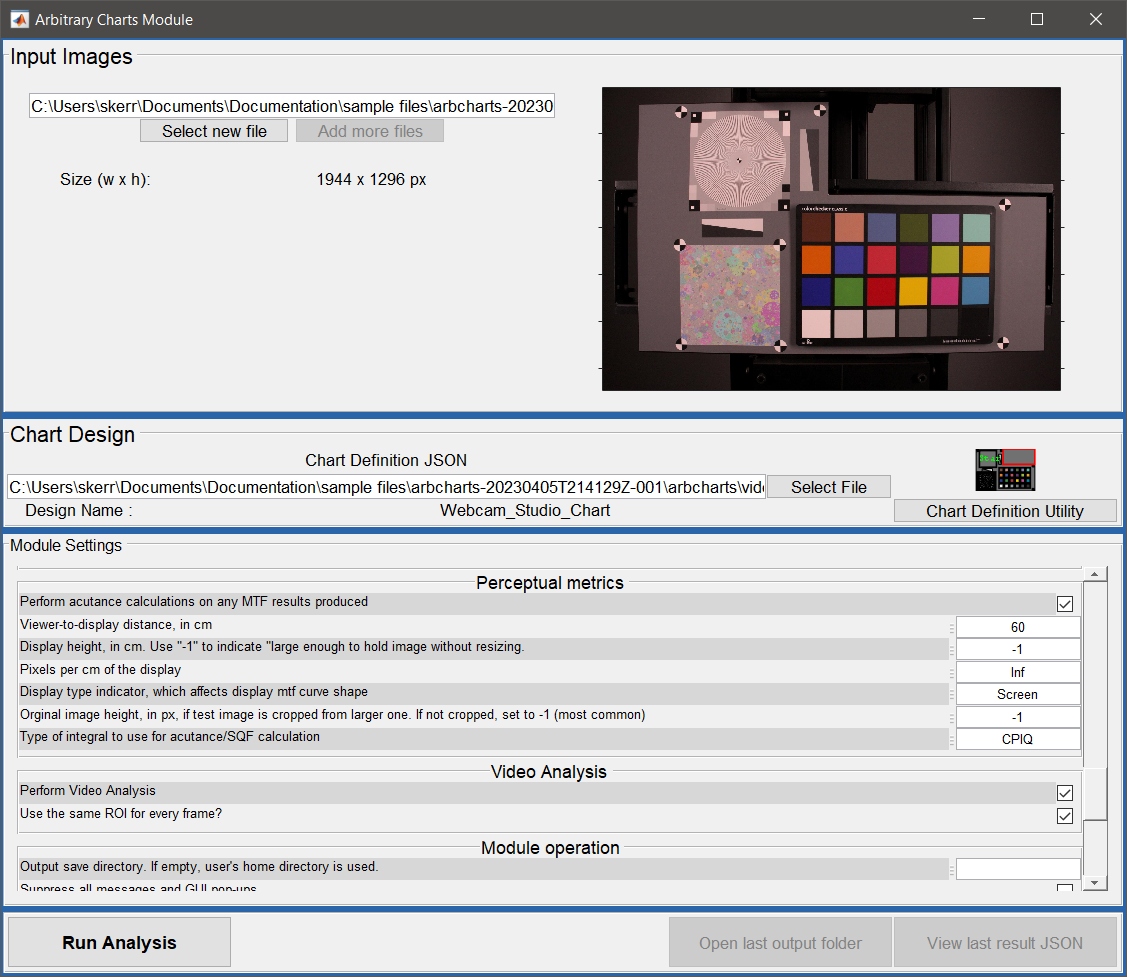
3. Load in the chart definition JSON then verify that Perform Video Analysis is enabled in the Video Analysis section of the Arbitrary Charts analysis window. It is recommended to check the Use the same ROI for every frame? option when analyzing a video of a static scene to reduce the computational runtime.

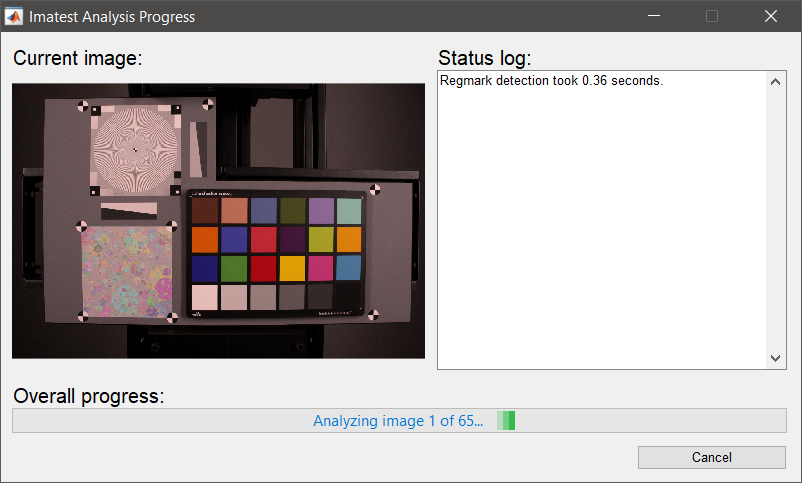
4. Click Run Analysis and confirm the chart alignment by clicking Continue on the Automatic Alignment Confirmation window. The Imatest Analysis Progress window will provide updates on the analysis. In addition to the individual frame results or batch results, a VideoAnalysis JSON containing auto exposure results can also be found in the last output folder.

Video Analysis Results
Auto Exposure
| Field Name | Units | Format | Description |
|---|---|---|---|
| Patch_Index | – | 1 x num_patches, integer | List of gray scale patches used for auto exposure analysis. Gray scale patches are defined as ColorPatchFeatures with reference L*a*b* values within 5 ΔC of [50, 0, 0]. The indices listed are consistent with the provided chart definition file. |
| Frame_Times_seconds | seconds | 1 x num_frames, double | Time in seconds of each frame analyzed. |
| Scene_Change_Onset_seconds | seconds | 1 x num_patches, double | Time of initial scene change in seconds, determined from measured L* values for each patch. |
| Scene_Change_Time_seconds | seconds | 1 x num_patches, double | Duration of initial scene change in seconds measured as 10-90% rise time or 90-10% fall time. |
| Scene_Change_Rise_or_fall | – | 1 x num_patches, string | “10-90% Rise Time” or “90-10% Fall Time” to indicate whether initial scene change was an increase in L* or decrease in L*. |
| Convergence_Time_Onset_seconds | seconds | 1 x num_patches, double | Time in seconds at which convergence occurs. Convergence is defined as the first frame of the first window which all L* measurements fall within ± 5% of the mean(L*) across that window. The window size is equal to 1/3 of a second (num_frames = 1/3 * video_fps), bounded by a minimum value of 10 frames and maximum value of 50 frames. |
| Convergence_Time_seconds | seconds | 1 x num_patches, double | Time in seconds between scene change onset and convergence onset. |
| Convergence_Target | – | 1 x num_patches, logical | Indicates whether the convergent L* value falls within ± 10% of the reference L* value. |
| Convergence_Stability | Perceptual Lightness | 1 x num_patches, double | Standard deviation of L* after convergence is achieved. |
| VCX_version | – | 1×1, string | VCX-Forum specification version. |
| Patch_Index_VCX | – | 1×1, integer | Index of gray scale patch with a reference L*a*b* value closest to [66.89, -0.75, -0.6], which corresponds to patch 21 of the X-Rite ColorChecker Classic. The index is consistent with the provided chart definition file. |
| Scene_Change_Onset_VCX_seconds | seconds | 1×1, double | Time of initial scene change in seconds, as determined by the VCX convergence test algorithm. |
| Convergence_Time_Onset_VCX_seconds | seconds | 1×1, double | Time of convergence in seconds, as determined by the VCX convergence test algorithm. |
| Convergence_Time_VCX_seconds | seconds | 1×1, double | Time in seconds between scene change onset and convergence onset. |
| Convergence_Target_VCX | – | 1×1, logical | Indicates whether the convergent L* falls within [65, 69]. |
| Convergence_Stability | Perceptual Lightness | 1×1, double | Standard deviation of L* after convergence is achieved. |

