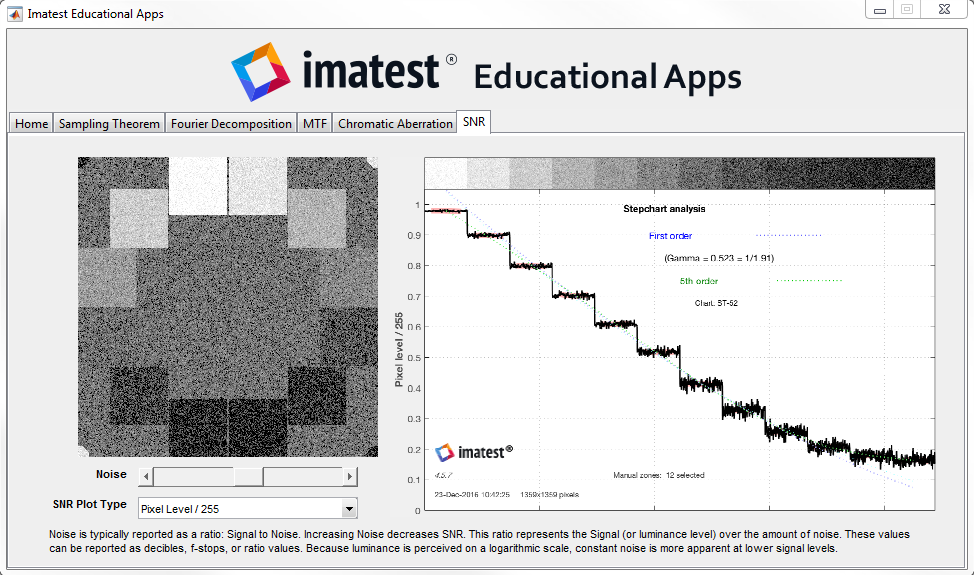
Introduced in Imatest 4.2, the Imatest Educational Apps serve to demonstrate mathematical concepts that directly relate to the understanding of image quality factors. The Imatest Educational Apps demonstrate Nyquist sampling theorem, the decomposition of an image’s Fourier transform, the Modulation Transfer Function of a slanted edge, chromatic aberration and signal to noise ratio (SNR). As an educational resource, this utility is available through the main window of your Imatest software.
To access the Imatest Educational Apps, go to the Imatest main window and select , then .
A Welcome splash screen will open by default. Select the tabs across the top to navigate to each module.
Each module has adjustable parameters that have an impact on image quality or demonstrate an iteration through a sequence. To manually adjust these parameters, drag the sliders. To automatically step through the available values of a particular parameter, select the play button (![]() ). You can only play through one parameter at a time. When playing, the play button will change to a stop button (
). You can only play through one parameter at a time. When playing, the play button will change to a stop button (![]() ).
).
Sampling Theorem
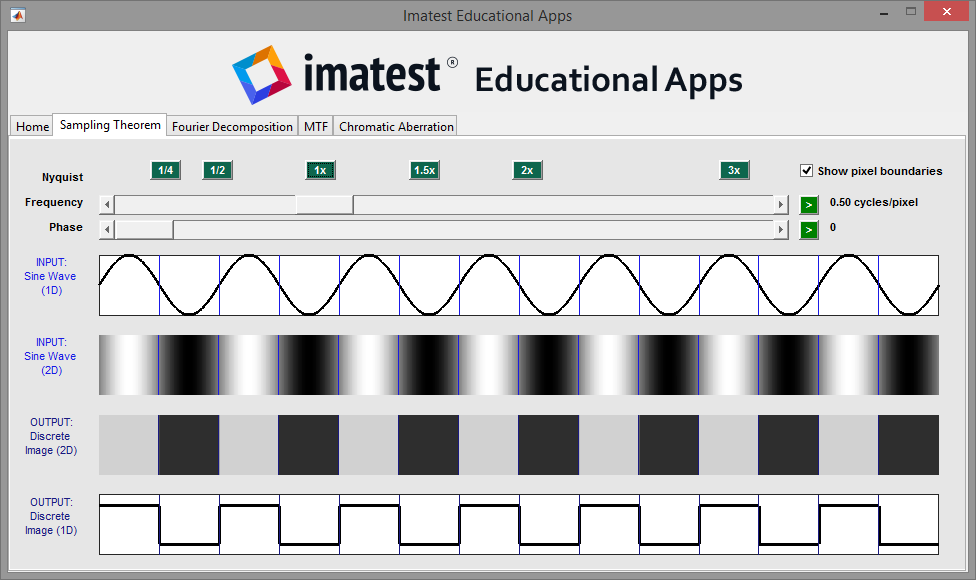
The Sampling Theorem tab allows you to adjust the frequency and phase of a 1D sine wave, observe its 2D representation, and observe the signal as it is digitized, simulating an ideal (not affected by optics or signal processing) digital imaging system.
Nyquist frequency refers to the maximum signal that an imaging system can reproduce, and is always 0.5 cycles/pixel. Adjusting the frequency slider to 0.5 cycles/pixel corresponds to 1x Nyquist frequency. Any input signal above Nyquist frequency is considered aliased. In imaging, certain frequencies are referred to by their corresponding fraction of Nyquist frequency.
Try adjusting the input frequency both above and below Nyquist frequency while also adjusting the input phase. Observe the resulting impact on an aliased and non-aliased signal.
A detailed description of Nyquist sampling theorem can be found on the Log Frequency documentation page.
Fourier Decomposition
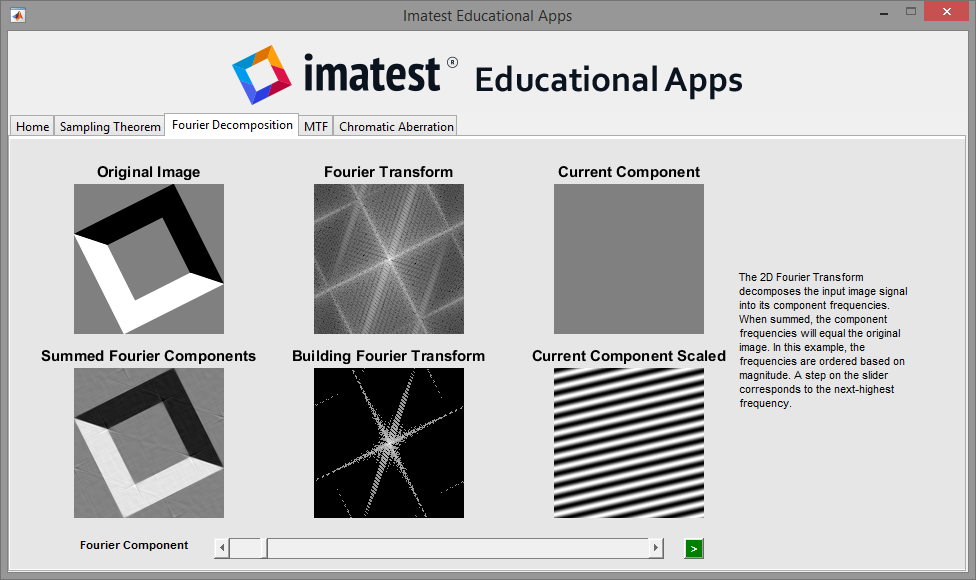
A 2D Fourier transform is useful for both visualization of and calculations regarding the component spatial frequencies of an image. The Original Image is shown on the top left, and its Fourier Transform is shown to the right. In the visual representation of the Fourier Transform, brighter regions correspond to the frequencies in the image that have the highest magnitude.
Modulation Transfer Function (MTF)
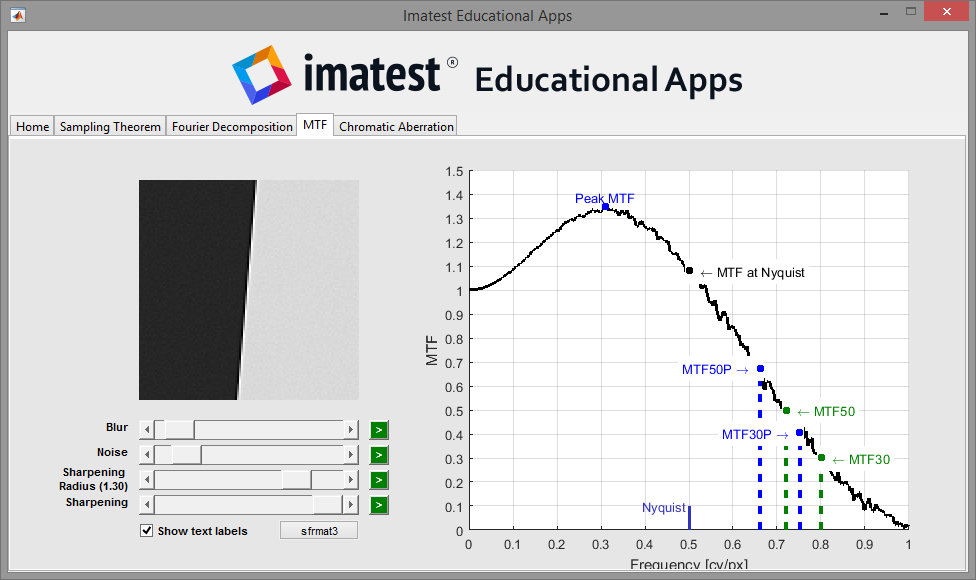
Understanding the Modulation Transfer Function (MTF), or Spatial Frequency Response (SFR), is critical to understanding sharpness, a critical imaging quality factor. The MTF of an imaging system describes the system’s ability to reproduce the different spatial frequencies.
The MTF of a complete imaging system is the product of the the MTF of its individual components. For example, a poorly designed lens would decrease the system’s MTF, but signal processing may sharpen the image and increase the system’s MTF.
For more information about MTF, see the Sharpness documentation page.
The MTF module utilizes sfrmat3, written by Peter D. Burns, 2009.
Chromatic Aberration
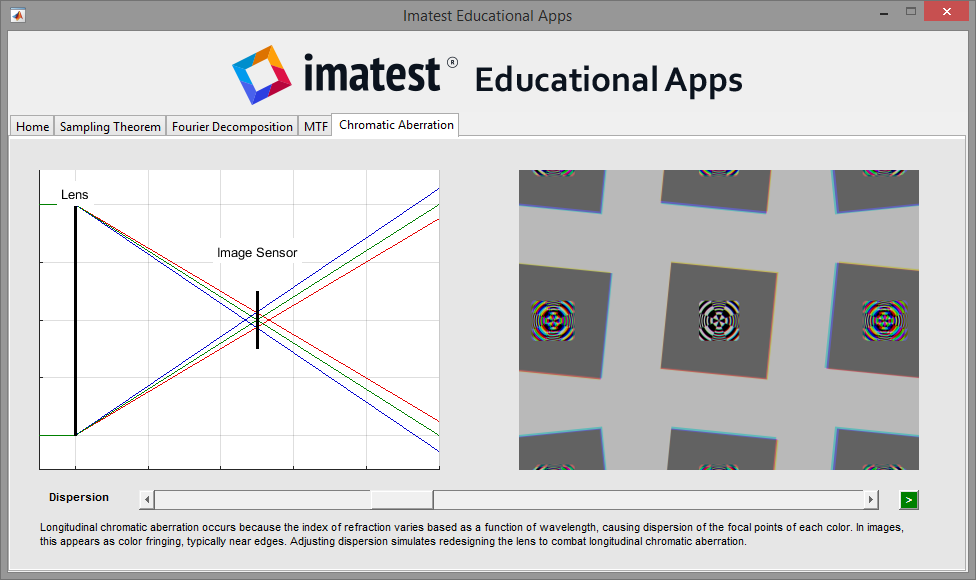
For a more mathematical explanation of chromatic aberration, see the Chromatic Aberration documentation page.
Signal to Noise Ratio (SNR)
Noise is typically reported as a ratio: Signal to Noise. Increasing Noise decreases SNR. This ratio represents the Signal (or luminance level) over the amount of noise. These values can be reported as decibels, f-stops, or ratio values. Because luminance is perceived on a logarithmic scale, constant noise is more apparent at lower signal levels.
