Instructions and comments
Under development
We are updating this page for the latest Skype for Business Video Capture Specification, December 2016.
An index of of the Skype/Lync specifications can be found on
https://technet.microsoft.com/en-us/office/dn788953
This document contains instructions for using Imatest with the Skype for Business Video Capture Specification, which has two versions: personal solutions (Document Number: H100693) and conferencing devices (Document Number: M1023160), published December 2016. “Skype for Business V3.0” appears on a watermark, and 3.0 is indicated in the Revision History (Section 1). It also contains comments and suggestions for running Imatest.
The Skype spec uses only a tiny fraction of Imatest’s powerful capabilities. To learn more, see Image Quality Factors and SFRplus (which allows many factors to be measured from a single image). In addition to the GUI-based Master version, non-GUI versions— IT/EXE and IT/DLL— that can interface with manufacturing testing systems are available. Imatest also supports the Microsoft Lync Logo Video Capture Specification and the CPIQ (Camera Phone Image Quality) Phase 2.0 specification.
Results of Skype tests are divided among three sections of the test specs: 2.2 Minimum requirements (required level), 2.3 HQV Requirements (preferred level; for 640×480 video resolution), and 2.4 HD Requirements (preferred level; for 720×1280 video resolution).
We continue to make enhancements to make it easier to obtain Skype results.
2.1.2 Acuity – MTF50 and Oversharpening, 2.1.14 Depth of field
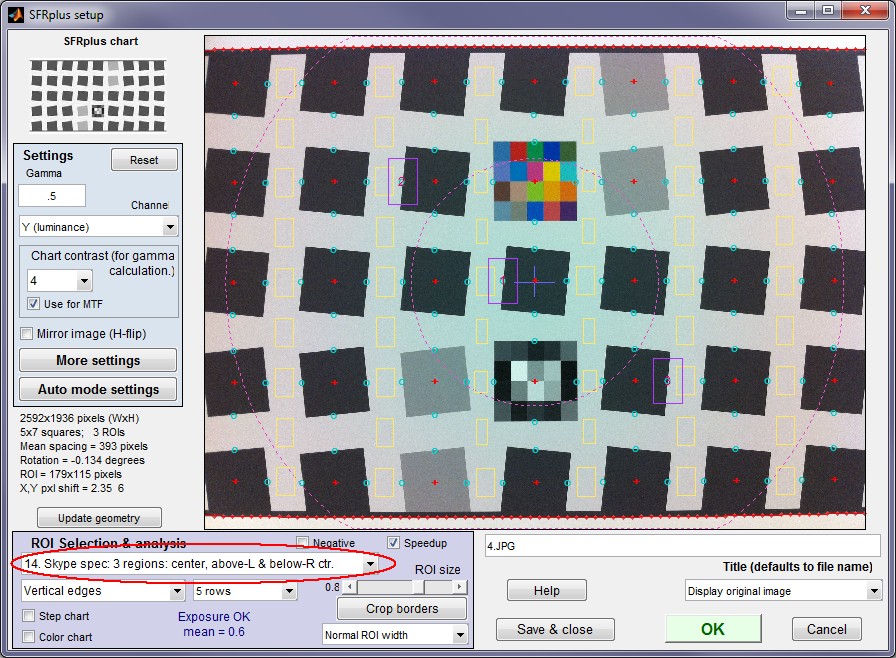
SFRplus has a region (ROI) selection setting that conforms to these tests.

SFRplus input settings, with Skype region (ROI) selection
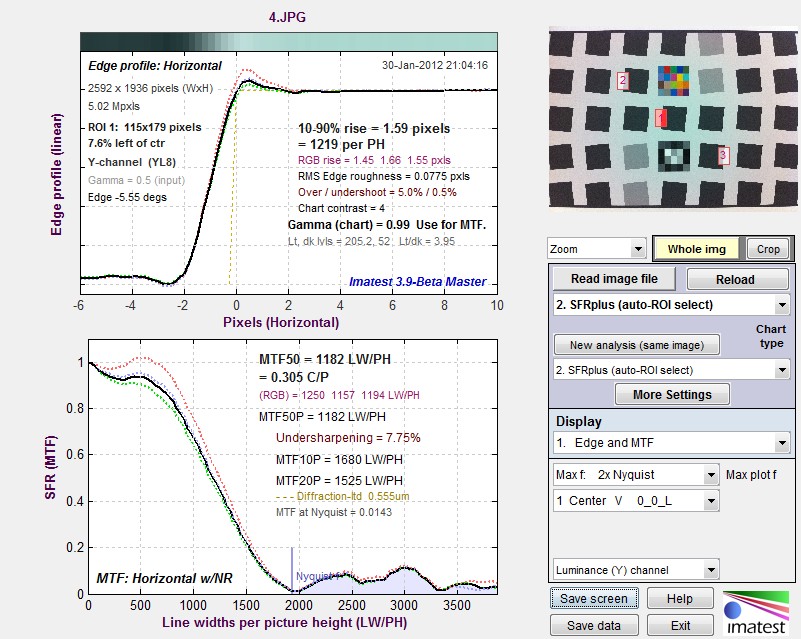
MTF50 and Oversharpening ( (–)undersharpening) are displayed in the Edge and MTF plot. In order to display Over/undersharpening, Display oversharpening only should be selected in the SFRplus More settings window (in the bottom-left of the Settings area).

SFRplus Edge and MTF plot, showing Under/Oversharpening and MTF50
[Modify the Multi-ROI summary to display PW50, Oversharpening, and 1st Secondary readout?]
MTF50 (LW/PH) and Oversharpening (%) are written to the multi-region CSV output file, which has a name or the form filename_extension_multi.csv (4_JPG_multi.csv for the above example.)

2.2.3 (300lux 5000K) MTF50 ≥ 0.25 cycles/pixel. 2.3.3 (30 lux 3000K) MTF50 ≥ 0.33 cycles/pixel. 2.3.4 (300 lux 5000K) MTF50 ≥ 0.38 cycles/pixel. Fairly strong sharpening is usually required to meet the numbers in 2.3.3 and 2.3.4. 2.3.5 (300 lux 5000K) Oversharpening ≤ 40%. This number is associated with strong sharpening: edge artifacts (“halos”) should be highly visible with Oversharpening > 40%.
2.1.3 Lens distortion – SMIA distortion
Imatest uses a different method to measure SMIA distortion, with slightly different (generally larger) results because the measure is extrapolated to represent lines whose separation is 98% of the image height. Distortion can be measured with SFRplus, Distortion, and Dot Pattern.

SFRplus Image & Geometry plot, showing SMIA TV Distortion (-1.46%)
2.3.6 (300 lux 5000K, though lighting does not matter): |DSMIA| ≤ 3%. This spec should be easy to achieve, especially since distortion can be easily corrected in software (many cameras now do this).
2.1.4 Lens distortion – Stretch distortion
This can be derived from the Horizontal/Vertical aspect ratio, displayed (above) in the SFRplus Image & Geometry plot. Aspect ratio is A = Δw/Δh.
In the Skype spec, DStretch = 100%(w – h)/w = 100%(1 – h/w) = 100%(1 – 1/A).
2.3.7 (300 lux, 5000K, though lighting does not matter): |DStretch| ≤ 5%. This should be easy to achieve.
2.1.5 SNR – Spatial noise deviation
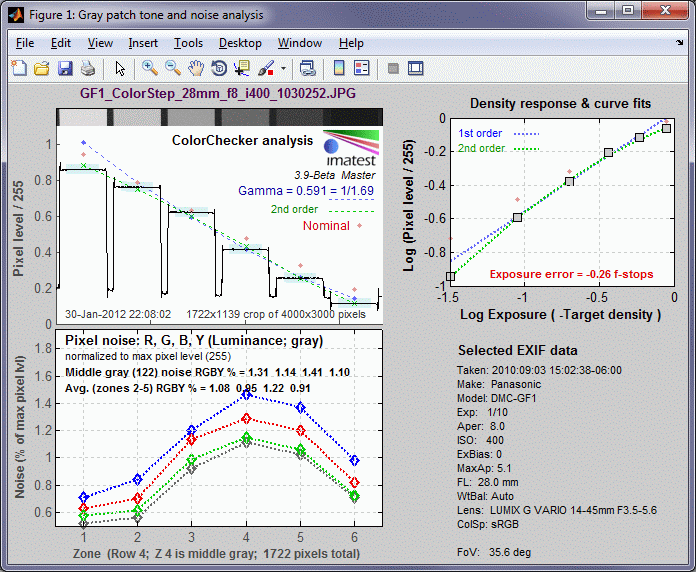
SNR and related measurements can be obtained from a standard Colorcheck run using an image of an X-Rite Colorchecker.

The (normalized) pixel levels are shown in the upper-left plot, and the standard deviations σ, which are the same as noise, (in units of % of the maximum pixel level, 255) are shown on the lower-left. There are other display options: SNR could have been shown instead. All results are summarized in the CSV output file. Here are portions:
| Zone | Gray | Pixel | Pixel/255 | Px/255 ideal | Log(exp) | Log(px/255) | WB Err Deg | WB Err Mired | WB ERR S(HSV) | WB Delta-C ab | WB Delta-C 94 | WB Delta-C 00 |
| 19 | 1 | 219.6 | 0.8611 | 0.949 | -0.05 | -0.065 | -399 | 10.1 | 0.046 | 3.21 | 3.1 | 4.53 |
| 20 | 2 | 194.9 | 0.7644 | 0.7882 | -0.23 | -0.117 | -245 | 6 | 0.029 | 2.49 | 2.46 | 3.37 |
| 21 | 3 | 159 | 0.6235 | 0.6314 | -0.44 | -0.205 | -387 | 9.7 | 0.045 | 3.22 | 3.16 | 4.13 |
| 22 | 4 | 106.1 | 0.4162 | 0.4784 | -0.7 | -0.381 | -358 | 9 | 0.043 | 1.86 | 1.85 | 1.99 |
| 23 | 5 | 65.3 | 0.2562 | 0.3255 | -1.05 | -0.591 | -453 | 11.5 | 0.059 | 2.69 | 2.64 | 2.77 |
| 24 | 6 | 29.1 | 0.1141 | 0.1922 | -1.5 | -0.943 | -268 | 6.6 | 0.042 | 1.42 | 1.39 | 1.42 |
| A | B | C | D | E | F | G | H | I | J | K | L | M | N | O | P |
| Zone | Gray | A-noise | A-fstop | Y-noise% | R-noise% | G-noise% | B-noise% | ||||||||
| (Zones 1-18 (Rows 1-3), which contain color (non-grayscale) patches, are omitted here.) | |||||||||||||||
| 19 | 1 | 0.689 | 0.839 | 0.773 | 0.953 | 0.216 | 0.262 | 0.242 | 0.298 | 0.814 | 0.254 | 0.515 | 0.627 | 0.577 | 0.712 |
| 20 | 2 | 0.754 | 0.944 | 0.825 | 1.126 | 0.036 | 0.045 | 0.039 | 0.054 | 0.912 | 0.044 | 0.563 | 0.705 | 0.616 | 0.841 |
| 21 | 3 | 1.238 | 1.522 | 1.322 | 1.607 | 0.051 | 0.062 | 0.054 | 0.066 | 1.422 | 0.058 | 0.925 | 1.137 | 0.988 | 1.2 |
| 22 | 4 | 1.491 | 1.725 | 1.54 | 1.96 | 0.081 | 0.094 | 0.084 | 0.107 | 1.679 | 0.091 | 1.113 | 1.288 | 1.151 | 1.464 |
| 23 | 5 | 1.37 | 1.607 | 1.418 | 1.833 | 0.124 | 0.145 | 0.128 | 0.165 | 1.557 | 0.14 | 1.023 | 1.201 | 1.059 | 1.369 |
| 24 | 6 | 0.946 | 1.097 | 0.965 | 1.311 | 0.113 | 0.131 | 0.115 | 0.156 | 1.08 | 0.129 | 0.707 | 0.82 | 0.721 | 0.979 |
| S/N (signal/noise) and SNR(dB) (20*log10(signal/noise)) for the 6 gray patches. A is Average of RBGY channels. | |||||||||||
| Zone | Gray | Y-S/N | R-S/N | G-S/N | B-S/N | Y-SNR(dB) | R-SNR(dB) | G-SNR(dB) | B-SNR(dB) | A-S/N | A-SNR(dB) |
| 19 | 1 | 167.235 | 141.119 | 147.581 | 118.668 | 44.467 | 42.992 | 43.381 | 41.487 | 143.651 | 43.081 |
| 20 | 2 | 135.755 | 110.39 | 123.182 | 89.868 | 42.655 | 40.859 | 41.811 | 39.072 | 114.799 | 41.099 |
| 21 | 3 | 67.422 | 56.386 | 62.43 | 50.993 | 36.576 | 35.023 | 35.908 | 34.15 | 59.308 | 35.414 |
| 22 | 4 | 37.379 | 32.996 | 35.928 | 27.798 | 31.453 | 30.369 | 31.109 | 28.88 | 33.525 | 30.453 |
| 23 | 5 | 25.034 | 21.961 | 23.977 | 18.135 | 27.971 | 26.833 | 27.596 | 25.171 | 22.277 | 26.893 |
| 24 | 6 | 16.143 | 14.239 | 15.699 | 11.429 | 24.16 | 23.069 | 23.918 | 21.16 | 14.377 | 23.077 |
2.3.8, 2.3.9 (30 lux 3000K and 5000K) σMAX < 2.7. 2.3.10, 2.3.11 (300 lux 3000K and 5000K): σMAX < 1.7. In the above tables, σMAX = 1.113%*2.55 = 2.83. This spec seems rather stringent.
2.1.6 SNR – Temporal noise
Temporal noise is measured by running , Multicharts, Multitest, or Colorcheck, selecting two identical Colorchecker images, and indicating that this is for Temporal noise (not separate or combined analysis). A fifth Colorcheck figure is available for Temporal noise, and all results are written to the CSV output file. The key Skype results in the CSV output— the worst Y (luminance) channel SNR (dB) for gray patches 1-5— are shown below.

Skype Temporal noise result: worst Y-channel SNR (db) of gray patches 1-5
2.3.12, 2.3.13 (30 lux): SNRTemporal ≥ 30dB, 2.3.14, 2.3.15 (300 lux): SNRTemporal ≥ 35dB. This spec is quite stringent.
2.1.7 Color accuracy and Saturation
 These are measured with standard Multicharts, Multitest, or Colorcheck runs. In the Colorcheck settings window, Color error display should be set to Delta-C, Delta-E (standard). (Note: we would have preferred Delta-C 94 or Delta-C 00, both of which are more recent and accurate as perceptual color difference measurements.)
C¯r in the Skype spec (with ¯ above C) is Mean camera chroma (saturation) in the plot.It is Mean camera chroma % in the CSV output file.
ΔC*avg-abcorr is on the second line (right side) of the plot. It is Mean Delta-C sat corr in the CSV output file.
ΔC*abcorr (patch no. 2) (light skin) is the second line below Delta-C(corr) in the CSV output file.

2.1.8 Exposure accuracy
Exposure accuracy can be obtained from a standard Multicharts, Multitest, or Colorcheck run. The standard Imatest calculation (Exposure error (f-stops) in the CSV output file; displayed in all figures except a*b* color error) is slightly different from the Skype spec. The Imatest measurement uses patches 2-5 from the bottom row of the Colorchecker, while the Skype spec uses all 6 patches. The logic behind the Imatest calculation is that patch 1 is sometimes saturated (P1 = 255) and is often in the highly nonlinear “shoulder” region of the response, while patch 6 is too dark to be visually significant in estimating exposure error (and on rare occasions Pi may be zero so that log(Pi) = -∞. For patch 6, common tonal response curves with nearly invisible irregularities can have a large effect on the measured results.
Additional details: Pi is the luminance channel = 0.3*Ri + 0.59*Gi + 0.11*Bi .
2.2.4-2.2.8 (all light intensities, color temps): -1.5 ≤ Errexp ≤ 1.5
2.1.9 Dynamic range
The Skype Dynamic range, which is quite different from other Imatest dynamic range measurements, can be measured in a standard Stepchart run with an image of the Kodak/Tiffen Q-14 test chart, which consists of 20 patches with a density increment of 0.1 (3 patches per f-stop or EV) for a total tonal range of 1.9 density units = 6.3 f-stops (EV). This is considerably less than the dynamic range of most sensors and cameras. Essentially this spec flags really bad cameras (which may have excessive lens flare, defective sensors, or poorly-designed signal processing).
The Skype Dynamic range is the number of patches where the “brightness” step between the patches is greater than 0.02* the (maximum – minimum) brightness. In Imatest 3.9+ it is written to the CSV output file as shown below (… linear), and comparable values are written to the JSON output.
![]()
Skype Dynamic Range from the CSV output (linear is from the spec)
We have included a logarithmic measurement because we believe that a linear measurement is far from optimum. The eye has logarithmic response, and gamma (contrast) is defined using a logarithmic curve, which is a better indicator of camera performance.
2.1.10 Capture gamma
The Skype equation (apparently) uses the first two patches in the bottom row of the ColorChecker to calculate gamma. This is not representative of the overall gamma of the image because the first two patches are typically in the “shoulder” region of the contrast curve, where the contrast is often less than the visually-significant middle tones. Imatest uses patches 2-5 to calculate gamma.
The Imatest equation for gamma, reported in Colorcheck results, is based on a first order fit to patches 2-5 of the bottom row (which should be very close to the Skype equation in the great majority of cases). It is approximately
γ = log10(P2/P5)/(d5–d2), where Pi is defined identically to the Skype spec.
(We will be discussing this with Skype shortly.)
2.1.11 Light falloff and Color uniformity

This test is performed with Uniformity. A white board (or a uniform light source) should give identical results to a gray board. If a reflective target (i.e., any board) is used, extreme care should be taken to obtain uniform lighting.
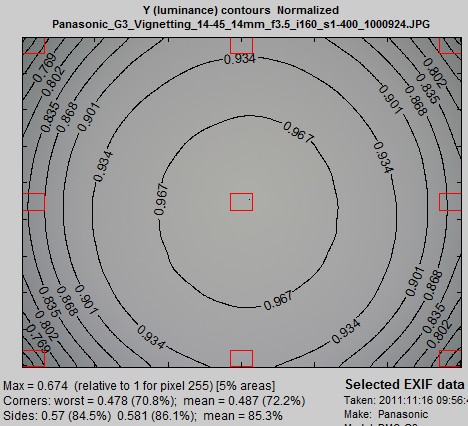
In the Uniformity settings window, select 5% for Corner and side regions. Location should be 0% (on image border), though 1% could be useful when there are shadows (that may be hard to see) next to the borders.
If you would like to see results in plots (they’re also in the CSV output), select Pixel contours only for Contour plots and Red/Green and Blue/Green for Color shading plots. We recommend checking Extra smoothing (on the right of the Color shading area) for best plot appearance.
The Y (luminance) contours are shown in the figure on the right. Relative illumination is
Irel = Pcenter/Pcorner(worstcase) = 100/(worst corner %)
where worst corner % = 70.8; hence Irel = 1.412. In the CSV file (Imatest 3.9+),

The R/G and B/G ratios are shown at the bottom of the Color shading figures and in the CSV output files.

3.4.4 Field of view consistency
In Imatest this is typically measured with SFRplus (not with Colorcheck or the Colorchecker chart). the definition could be clearer. Is FoV measured in pixels or percentage of image height, width, or diagonal? Action: Add centering and FoV statistics to the Exif Data and Color Matrix display of Multicharts and Multitest (there is space in this display), as well as to CSV and JSON output.
Please note that 2.1.12 Frame rate, 2.1.13 Delay, and 2.1.16 Video Encoding tests are not performed by Imatest.

