A comparison of sensitivity to signal processing:
Results for additional cameras
This page contains additional Slanted-edge, Siemens Star, and Log F-Contrast results for four cameras, in support of claims in Slanted-edge versus Siemens Star that
- Siemens Star MTF measurements are nearly as sensitive to sharpening as low-contrast (4:1) slanted-edge measurements. The Siemens Star’s high contrast (specified at >50:1) makes it quite sensitive to saturation and to “shoulders” (regions of reduced contrast) in camera tonal response.
- Slanted-edge MTF measurements are stable, reliable, and more representative of perceived image sharpness under a wide range of conditions (in addition to their many well-known advantages: higher speed and more efficient use of space, which enables detailed sharpness maps).
Results for four very different cameras are presented on this page.
- Samsung Galaxy S4: a well-regarded 13 megapixel camera phone. Fixed aperture 4.2mm f/2.2 lens @ f/2.2.
- Panasonic Lumix DMC-G3: a medium-level 16 megapixel Micro Four-Thirds mirrorless camera (with a nice eye-level viewer). Comparable in image quality with higher-end models. Leica DG Macro-Elmarit 45mm f/2.8 @ f/5.6.
- Canon EOS-6D: a high-end 20 megapixel full-frame DSLR. 100mm f/2.8 macro @ f/5.6.
- Nikon D800E, Macro Nikkor 60mm F/2.8 a high-end 36 megapixel full-frame DSLR with no anti-aliasing (Optical Lowpass) Filter. AF-S Micro Nikkor 60mm f/2.8G ED @ f/5.6.
Samsung Galaxy S4
Log F-Contrast results are of great interest because they show the effects of contrast on sinusoidal MTF measurements. In most cases, the results for the top (high contrast) row corresponds to Star chart measurements.
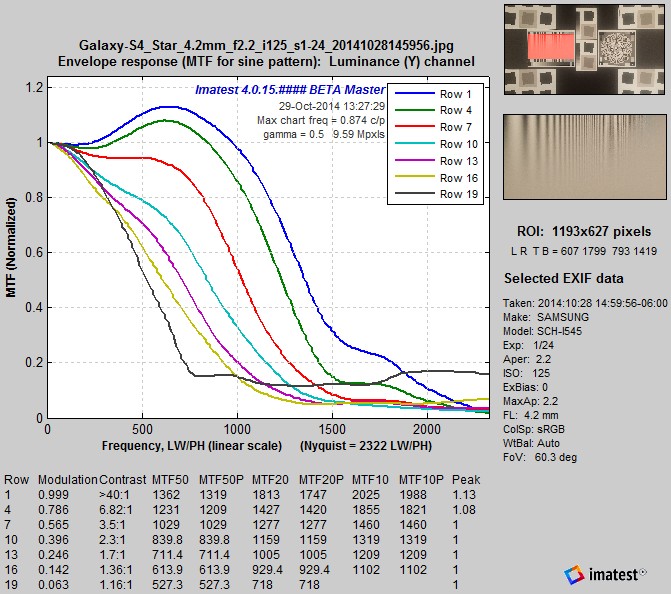 Samsung Galaxy S4, MTF curves for Log F-Contrast, Samsung Galaxy S4, MTF curves for Log F-Contrast,rows 1-19 in steps of 3, camera JPEG @ ISO 125 |
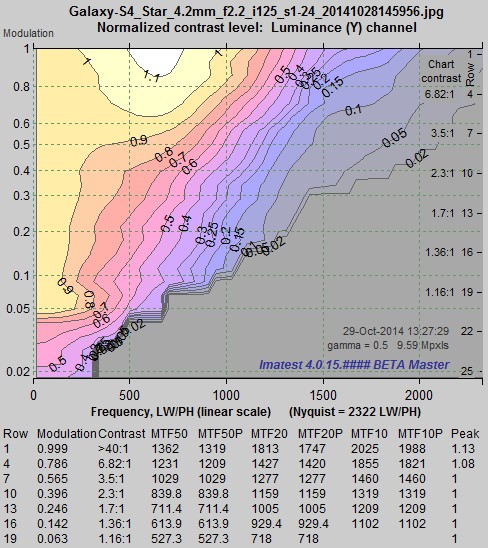 Samsung Galaxy S4, MTF contours for Log F-Contrast, Samsung Galaxy S4, MTF contours for Log F-Contrast,camera JPEG @ ISO 125 |
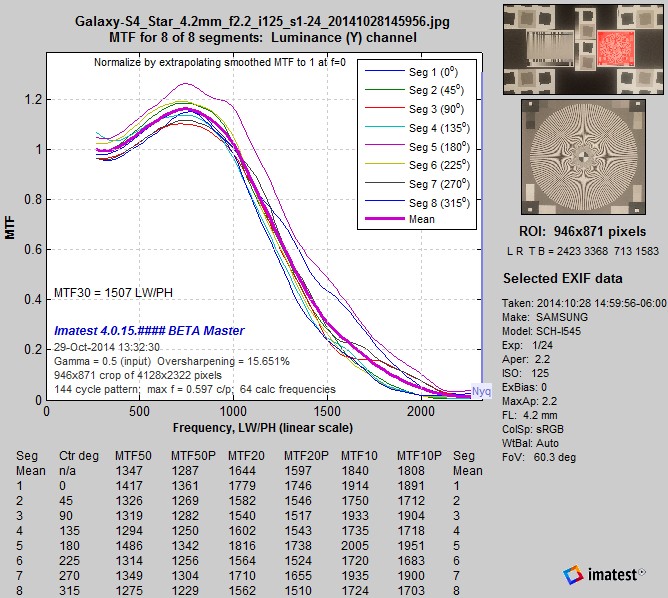
The Galaxy S4 has excellent response with moderate sharpening at high contrast, but sharpening decreases and noise reduction increases rapidly as contrast drops. This is common behavior in small-sensor camera phones. We expect texture detail to be weak.
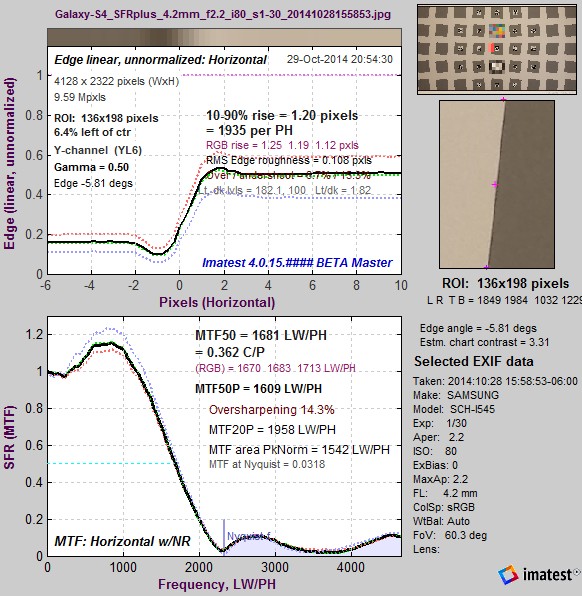
Summary— For the Samsung Galaxy S4 phone, the Siemens Star MTF is very similar to the 4:1 contrast Slanted-edge (and between the 2:1 and ~12:1 edges on the same chart as the star).
Panasonic Lumix DMC-G3
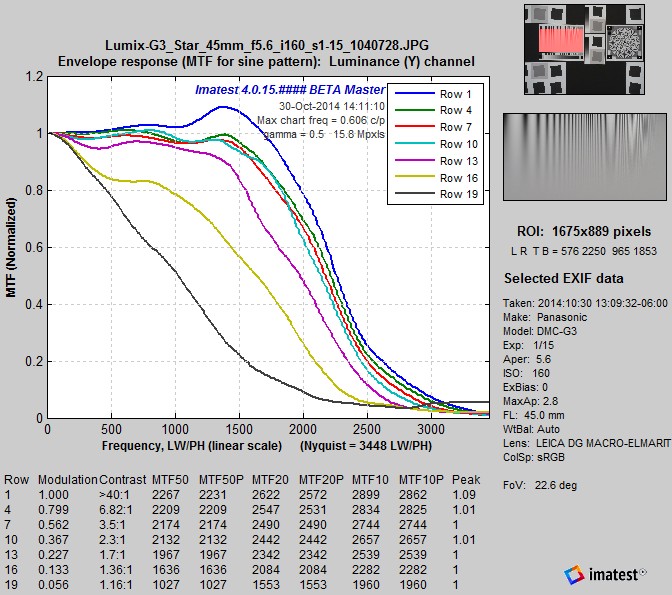 Lumix DMC-G3, MTF curves for Log F-Contrast, Lumix DMC-G3, MTF curves for Log F-Contrast,rows 1-19 in steps of 3, camera JPEG @ ISO 160 |
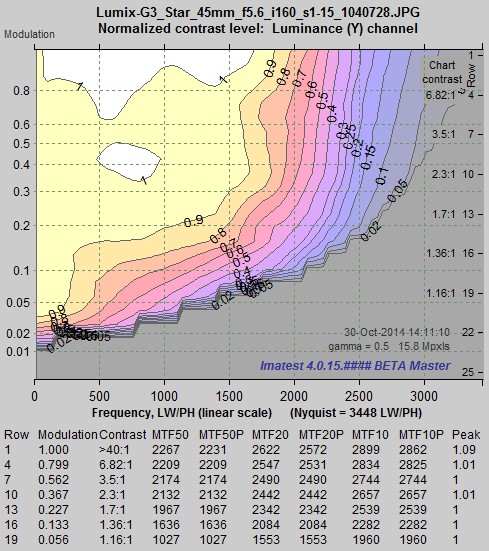 Lumix DMC-G3, MTF contours for Log F-Contrast, Lumix DMC-G3, MTF contours for Log F-Contrast,camera JPEG @ ISO 160 |
The DMC-G3 behaves very differently from the Galaxy S4. It has a moderate sharpening peak and it maintains contrast quite well down to modulation around 0.2 (about 1.6:1 contrast), after which it falls rapidly. Results are very close to results we’ve analyzed from Imaging-Resource.
|
Siemens Star measurements
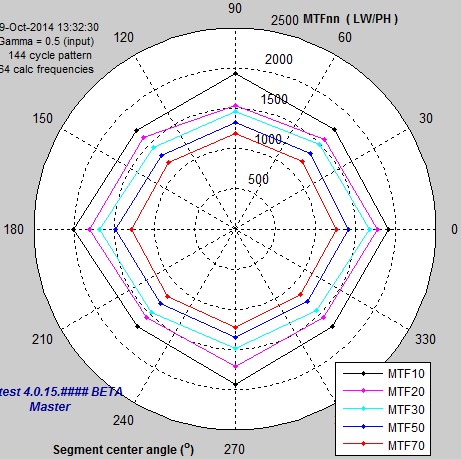
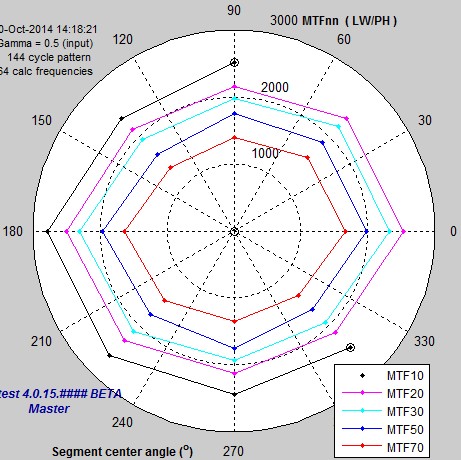
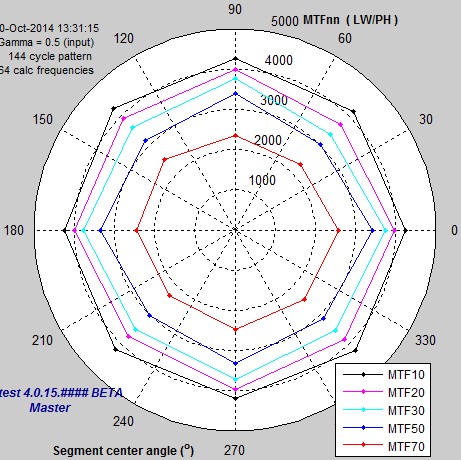
The MTFnn contour plot is also a little different from the Samsung Galaxy G4: diagonal MTFs are slightly closer to the Horizontal and Vertical MTFs. |
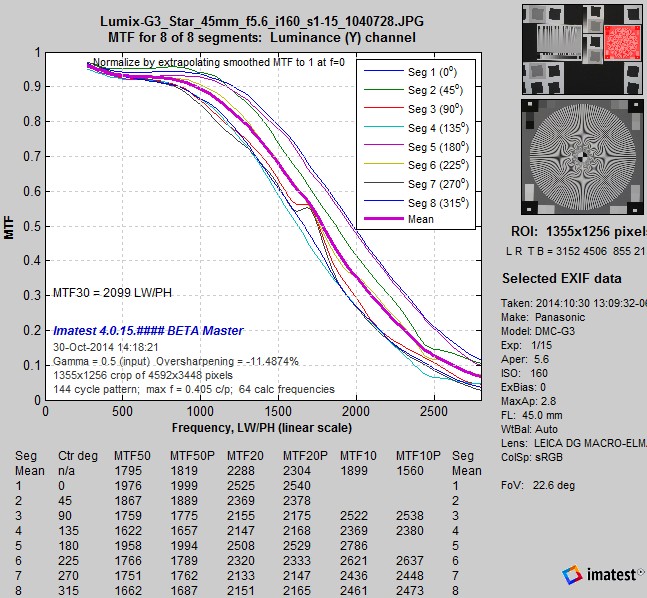 Lumix DMC-G3, MTF for Siemens Star, Lumix DMC-G3, MTF for Siemens Star,camera JPEG @ ISO 160 |
|
Slanted-edge measurements For simplicity we show only the Edge/MTF plot for 4:1 contrast (the SFRplus chart), and we summarize the other results in a table.
|
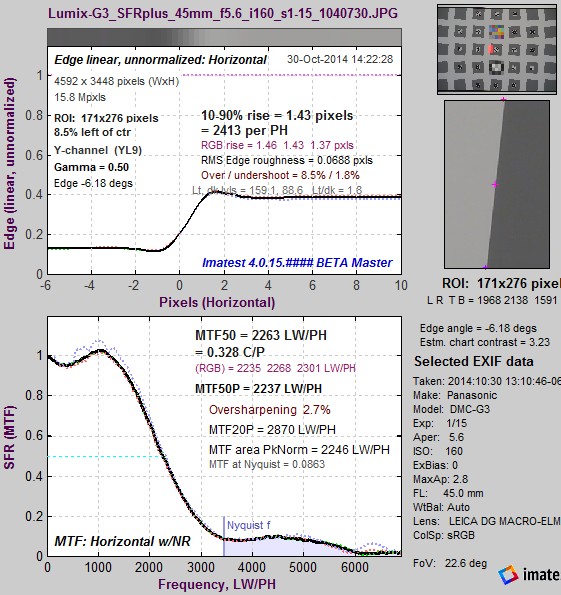 Lumix DMC-G3, MTF for 4:1 slanted-edge, Lumix DMC-G3, MTF for 4:1 slanted-edge,camera JPEG @ ISO 160 |
Summary— For the Panasonic Lumix DMC-G3, the Siemens Star MTF is very similar to the 4:1 contrast Slanted-edge (and between the 2:1 and ~12:1 edges on the same chart). But it is unusual in that it’s lower than the top row of the Log F-Contrast chart.
Canon EOS-6D
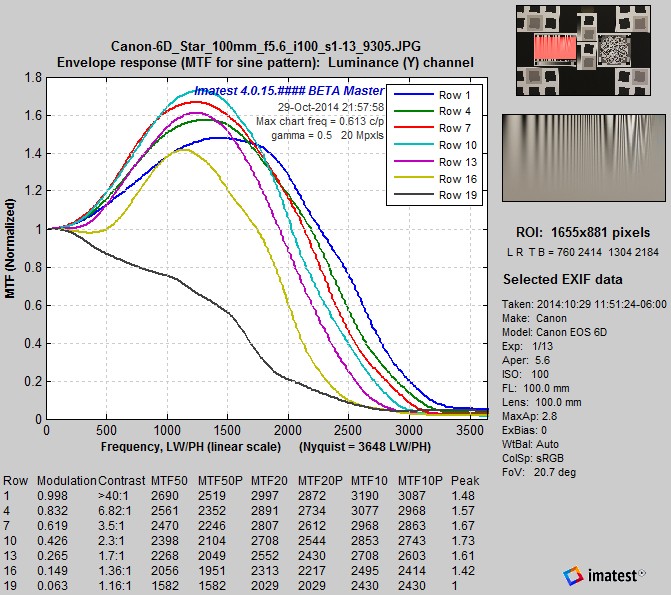 Canon EOS-6D, MTF curves for Log F-Contrast, Canon EOS-6D, MTF curves for Log F-Contrast,rows 1-19 in steps of 3, camera JPEG @ ISO 100 |
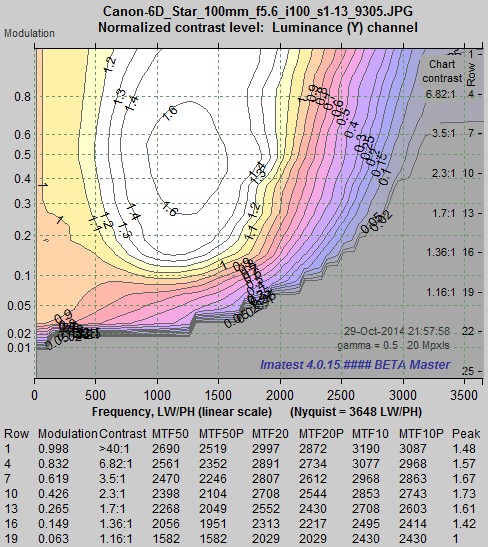 Canon EOS-6D, MTF contours for Log F-Contrast, Canon EOS-6D, MTF contours for Log F-Contrast,camera JPEG @ ISO 100 |
The EOS-6D has a very strong sharpening peak. MTF drops slowly between maximum modulation and modulation around 0.15 (about 1.5:1 contrast). It drops quite rapidly below modulation = 0.15. It is interesting to compare these results with results we’ve analyzed from Imaging-Resource. The general features of the contours are similar, but their sharpening was much weaker at high modulation levels (near the top of the chart). The reason seems to be that their image is lighter, hence there is less “headroom” for sharpening boost without running into saturation. Canon may well reduce sharpening in light, high-contrast regions to minimize saturation effects. (We haven’t done systematic tests of how exposure affects MTF response.)
|
Siemens Star measurements The MTF response of the Siemens Star displays moderately strong sharpening,but it’s different from most of the cameras we tested in that it’s significantly lower than row 1 of the Log F-Contrast chart.
|
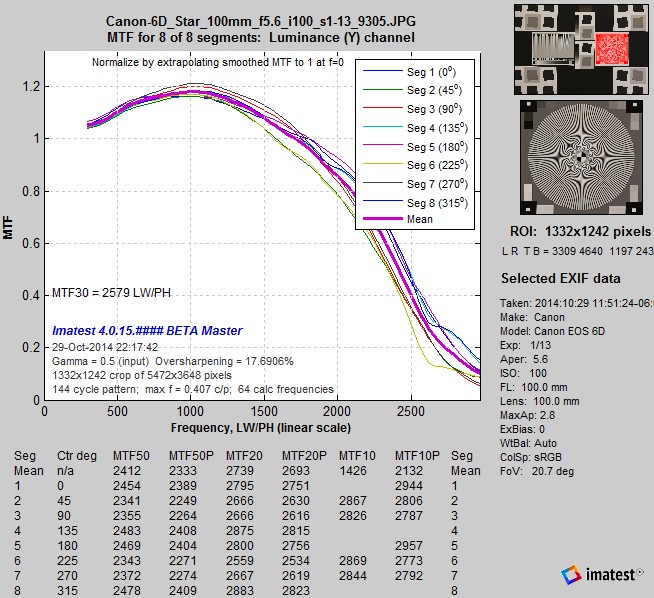 Canon EOS-6D, MTF for Siemens Star, Canon EOS-6D, MTF for Siemens Star,camera JPEG @ ISO 100 |
|
Slanted-edge measurements To keep things simple, we show only the Edge/MTF plot for 4:1 contrast (the SFRplus chart), and we summarize the other results in a table.
|
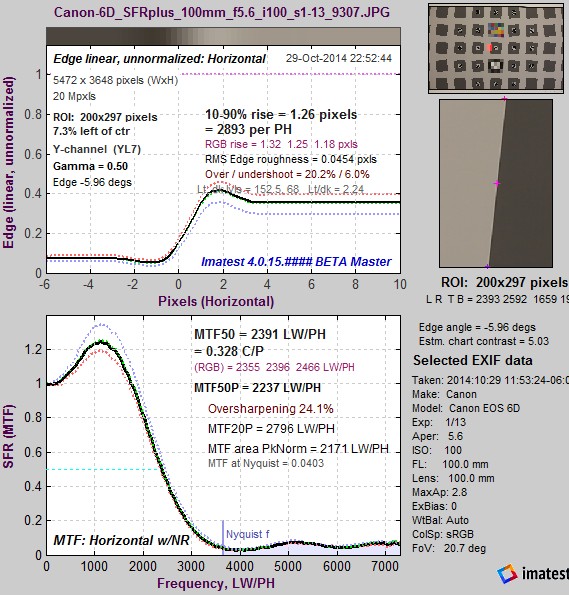 Canon EOS-6D, MTF for 4:1 slanted-edge, Canon EOS-6D, MTF for 4:1 slanted-edge,camera JPEG @ ISO 100 |
Summary— For the Canon EOS-6D, the MTF curves for the Siemens Star and the 4:1 contrast Slanted-edge is very similar. But it is unusual in that it’s lower than the top row of the Log F-Contrast chart. There is some complex image processing happening here.
Nikon D800E
Because of the extremely high resolution of the D800E (36 megapixels; no anti-aliasing filter) we had to move the camera further than usual from the charts. When framed the same as the other cameras we couldn’t get to high enough spatial frequencies on the Siemens star.
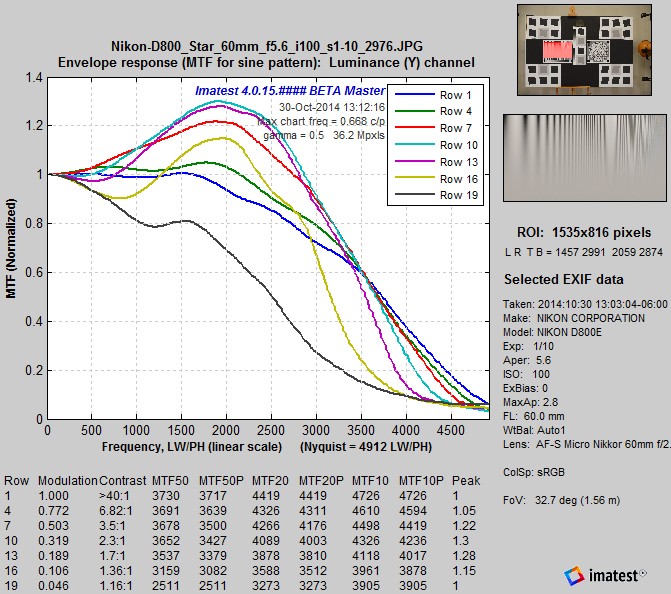 Nikon D800E, MTF curves for Log F-Contrast, Nikon D800E, MTF curves for Log F-Contrast,rows 1-19 in steps of 3, camera JPEG @ ISO 100 |
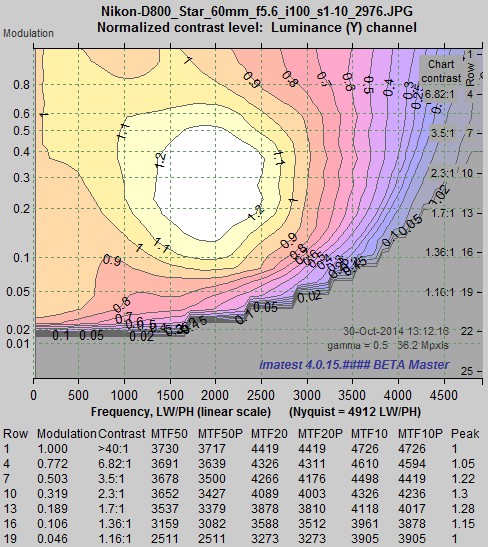 Nikon D800E, MTF contours for Log F-Contrast, Nikon D800E, MTF contours for Log F-Contrast,camera JPEG @ ISO 100 |
The Nikon D800E’s high frequency response is considerably more extended than the Canon EOS-6D, which is what you would expect of a 36 megapixel sensor without an Anti-Aliasing filters (vs. 20 megapixels with an AA filter). It is interesting to compare these results with results we’ve analyzed for the D800 (which has an AA filter) from Imaging-Resource. The general features of the contours are similar, but the response of the D800E is about 20% more extended.
|
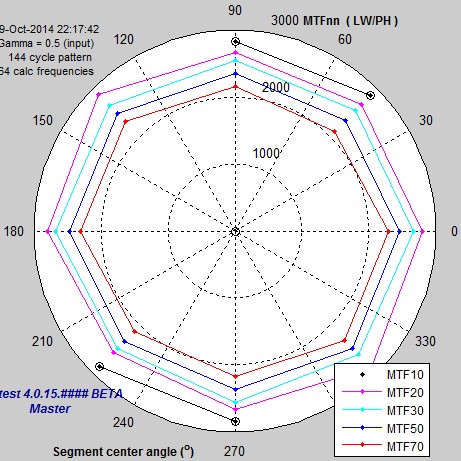
Siemens Star measurements The MTF response of the Siemens Star displays moderate sharpening: similar to row 1 of the Log F-Contrast chart, shown above.
|
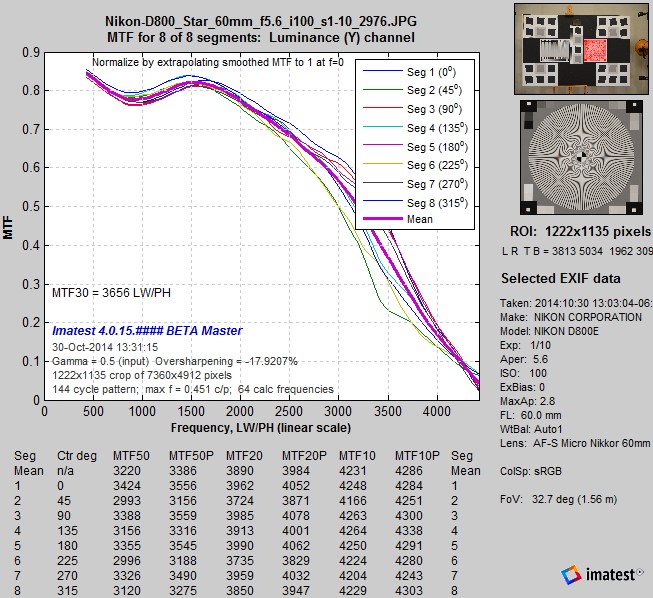 Nikon D800E, MTF for Siemens Star, Nikon D800E, MTF for Siemens Star,camera JPEG @ ISO 100 |
|
Slanted-edge measurements The relationship between sharpness and contrast is quite different for the D800E than for most other cameras. This is because noise reduction is not significant until contrast falls below 1.7:1. (The 0.5 (MTF50) contrast line in the Log F-Contrast contour plot, above, is nearly vertical.)
|
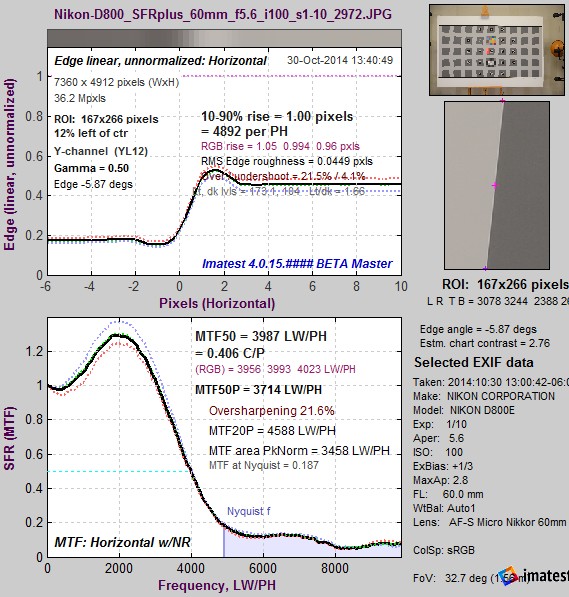 Nikon D800E, MTF for 4:1 slanted-edge, Nikon D800E, MTF for 4:1 slanted-edge,camera JPEG @ ISO 100 |
|
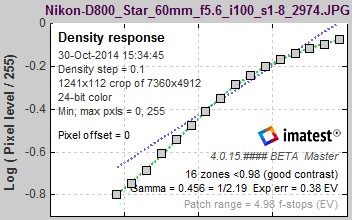
For the D800E, the sharpening peak increases as contrast decreases, reaching a peak at modulation = 0.3, equivalent to 2.3:1 contrast. The primary reason seems to be that the highlights are compressed due to the “shoulder” in the response curve: the region where the slope decreases, shown in the tonal response curve, below.
There is also an unusual shift in the lower pixel level for the high contrast curve at high spatial frequencies (also visible on the D800 image from Imaging-Resource). Along with the compression, this explains the reduced MTF for the high contrast region of the Log F-Contrast image and the Siemens Star chart. |
Pixels (used to calculate MTF) for Row 1 (highest contrast) and 10 (2.3:1 contrast, where MTF is highest). |
Summary— The Nikon D800E is rather unusual in that its sinusoidal MTF response is highest (due to maximum sharpening) around contrast = 2.5:1 and drops at the highest levels. This may be done intentionally in the signal processing pipeline to minimize saturation effects. As a result of this processing, the (>50:1 contrast) Siemens Star MTF is distinctly lower than the (4:1 contrast) slanted-edge. This does not mean that the Siemens Star is less sensitive to software sharpening.
Summary for this page
Results for four very different cameras confirm that the Siemens star is strongly affected by sharpening and is more affected by saturation (due to its high contrast, >50:1) than the 4:1 contrast slanted-edge. (Both of these contrast levels are specified in the ISO 12233:2014 standard.)


