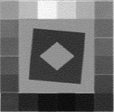
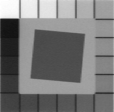
In addition to linear step charts (which have a single row of patches), three Imatest modules— Stepchart, Color/Tone Interactive (formerly Multicharts), and Color/Tone Auto (formerly Multitest)— can analyze the tonal response and noise of a number of additional multi-row grayscale charts (reflective and transmissive), most of which are available from the Imatest Store. With most of these charts you can choose between default reference values and a custom reference file that you can measure, or (for 26-patch Dynamic Range charts) are supplied by Imatest.
The recommended charts on this page are the 36-patch Dynamic range, ISO-14524, ISO-15739, and 20-patch circular charts.
|
Imatest Transmissive 36-patch Dynamic Range Charts Several versions available. |
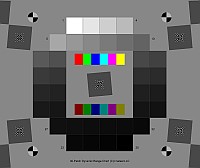 |
36 density patches with density steps ≥ 0.1, ranging from base density to base+3, base+6, or base+8, depending on the specific chart type. (These are much higher densities than reflective charts can achieve). A nearly circular patch arrangement ensures that vignetting has minimal effect on results. the chart has an active area of 7.75×9.25 inches on 8×10 inch film. A reference file with actual densities is supplied.
It also contains 4:1 contrast slanted edges for measuring MTF. Registration marks make the regions easy to select and (in Imatest 4.0+) work with automatic region detection. A neutral gray background helps ensure that the chart will be well-exposed in auto exposure cameras. It is supported by Stepchart, Color/Tone Interactive, and Color/Tone Auto, and can be used with the Dynamic Range postprocessor if several manual exposures are available. These charts are produced with a high-precision LVT film recording process for the best possible density range, low noise, and fine detail. Available in the Imatest Store. |
|||||||||||||||||||||||||
QA-62 |
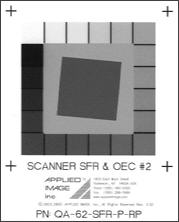 |
|
|||||||||||||||||||||||||
| ST-51 EIA Grayscale |
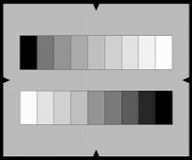 |
|
|||||||||||||||||||||||||
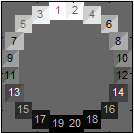
| ISO-14524 12-patch OECF target (circular) |
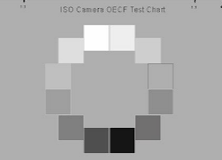 |
|
|||||||||||||||||||||||||
ISO-15739 Noise target |
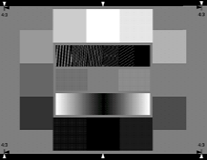 |
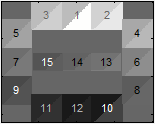
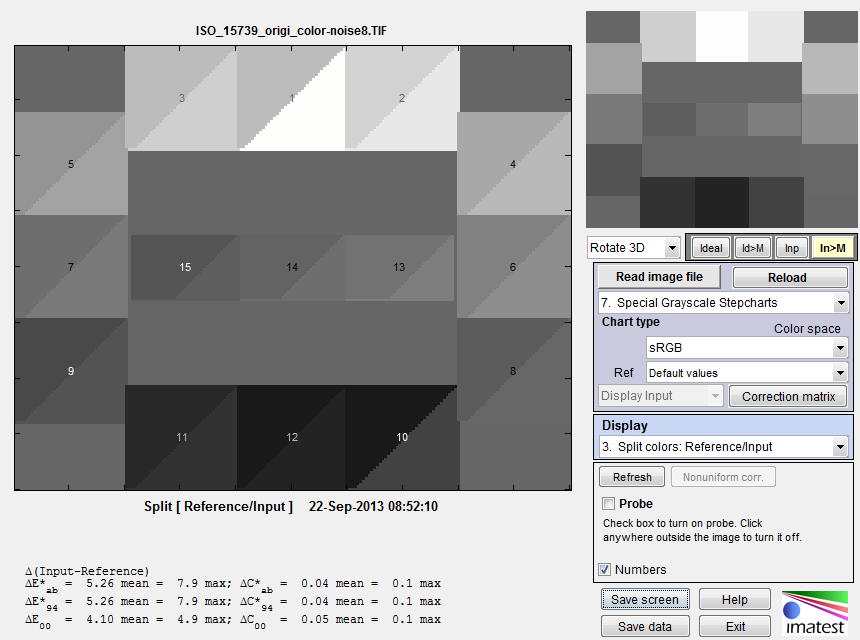
This is a 15-patch grayscale step chart with 12 of the patches in a somewhat elliptical arrangement on the periphery and three in an inside row. Nominal patch densities are 0.1, 0.19, 0.3, 0.41, 0.53, 0.66, 0.81, 0.97, 1.17, 1.39, 1.66, 2.0 for the 12 peripheral patches and 0.77, 0.90, 1.05 for the three central patches. The relatively large patches are especially good for measuring noise. All Stepchart measurements are supported. The inkjet-printed version available at the Imatest Store includes registration marks for automatic region detection in Imatest 4.0+. | |||||||||||||||||||||||||
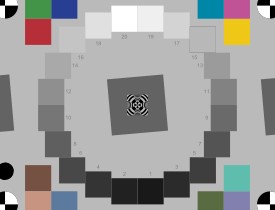
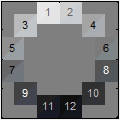
| The 20-patch circular OECF pattern in the center of the eSFR ISO (Imatest’s Enhanced ISO 12233:2014) chart | Several charts, including the eSFR ISO (ISO 12233:2014) chart, use this 20-patch arrangement. When OECF 20-patch circular is selected in the input dialog box (below), one of the following chart contrasts should be selected.
|
||||||||||||||||||||||||||
| ITE Grayscale |
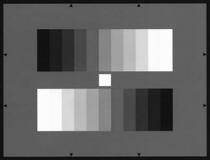 |
Comes in two versions: Type I: gamma = 0.45 and Type II: gamma = 1.0. Available from DNP (Japan), Zonetech (Korea), and Image Engineering/Esser Test Charts(Germany), where it is designated TE 83 and TE 84. Imatest can manufacture one on request. The maximum contrast ratio for both versions is approximately 40:1.When ITE Grayscale is selected in the input dialog box (below), either ITE Grayscale I: gamma = 0.45 or ITE Grayscale II: gamma = 1.0 should be selected in the box just above the ITE Grayscale radio button.ITE Grayscale densities (default Imatest reference values) Gamma = 0.45: 1.70 1.31 1.08 0.87 0.71 0.56 0.43 0.34 0.24 0.15 0.08 Gamma = 1: 1.70 1.00 0.74 0.58 0.46 0.37 0.30 0.23 0.18 0.13 0.08 |
|||||||||||||||||||||||||
| QA-61 ISO-16067-1 Scanner |
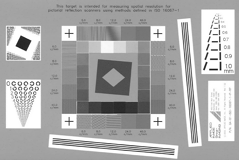 |
QA-61 | REFLECTIVE SCANNER TEST CHART (ISO-16067-1) | |||
| Data: | Size 100mm x 152mm (4in x 6in); Designed to ISO-16067-1 specifications. Includes Landolt Ring, alphanumeric resolution and slant edge charts; grey step patches, horizontal, vertical and slanted ronchi patterns (6 – 40 c/mm) plus the APPLIED T-100 Digital Electronic Pixel target. | |||||
| Notes: | Used for determining reflective light resolution & imaging characteristics of digital scanning systems. For full description, see QA-61 Product specifications. | |||||
| Part No. QA-61-ISO-16067-1-P-RP |
Overall Size 102 x 152mm (4 x 6in) |
Material Reflective Material |
||||
Instructions for Special/ISO charts
Run Stepchart, Color/Tone Interactive, or Color/Tone Auto by clicking on the appropriate button in the Imatest main window. The example below illustrates Stepchart: the procedures are similar for Color/Tone Interactive and Color/Tone Auto.
Select the approximate crop region, which typically includes only the grayscale patches, (Use the registration marks for selecting corners in the 36-patch Dynamic Range chart; ignore any crop or selection marks in other charts.) The crop does not have to be accurate; a find adjustment dialog box will appear later. If the crop aspect ratio is less than 3:1, Stepchart recognizes the chart as one of the Special/ISO charts.
|
The dialog box shown below appears. The cropped input image is shown on the right. Select the appropriate chart type using the radio buttons in the middle. The image on the left illustrates the chart type: the patches should match the input image on the right.
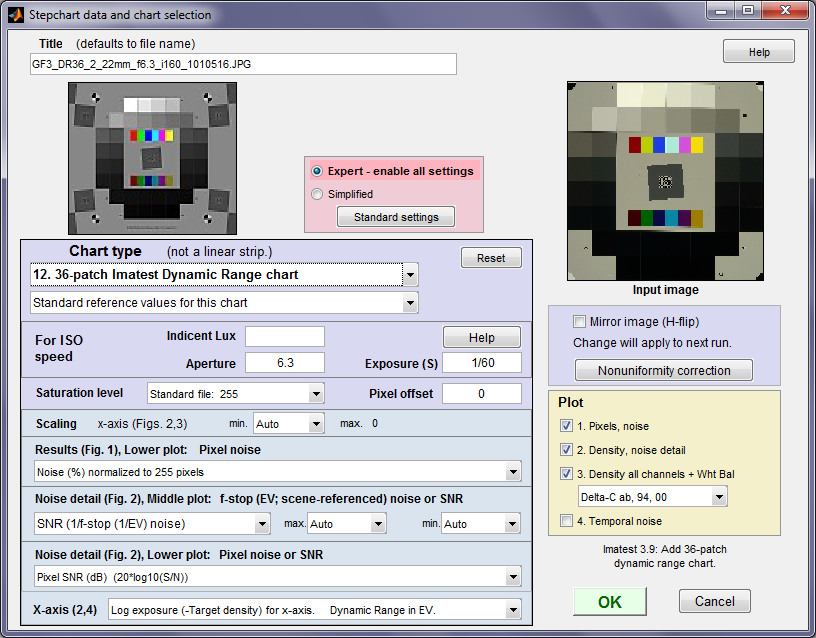
SFRplus settings window for non-linear charts.
Most settings are described in Using Stepchart.
| You can select either Expert or Simplified mode for the settings window. In Simplified mode many settings are grayed out so they can’t be set. If you press , commonly used settings (recommended for beginners) are selected. |
You can change the title if needed. You can select a file for reference density values if you choose not to use the standard values. The file should contain patch densities, one per line. The patch order is given below. The scaling box affects the x-axis and noise plots in Figures 2 and 3. It is identical to the standard Stepchart input dialog box. If you choose OECF 20-patch circular, choose one of the contrast settings listed in the above table.
If you click , the fine ROI selection box, shown below appears. You can move the entire ROI using one of the buttons on the top left: , , , or . You can move the top margin with or , the bottom margin with or , etc. Corners can also be adjust individually: useful in the presence of perspective or lens distortion. Author’s note: I would have liked to be able to click and drag on lines or corners, but the limitations of the Matlab interface didn’t allow this.
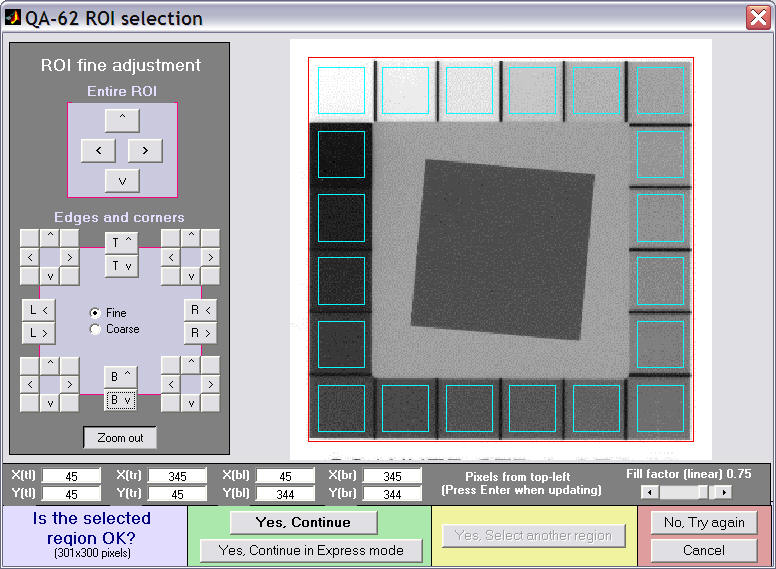
You can enter X and Y values for the corners (tl = top left, etc.): be sure to press Enter for each value if you do. The size of the selection is shown on the lower left. Fill factor (linear) (on the lower right, just above ) sets the size of the squares. It defaults to 0.7. It can be increased to obtain more samples for noise analysis, but it may need to be reduced if the image is tilted or distorted. The Distortion slider allows highly distorted (barrel or pincushion) images to be analyzed. Fill factor may have to be reduced in the presence of extreme distortion.
When the squares have been adjusted, click , , or .
The Output is the same as for standard linear step charts.
Patch order
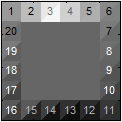
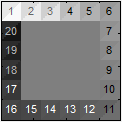
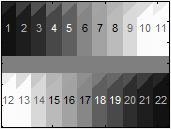
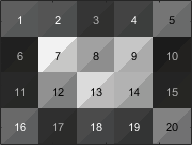
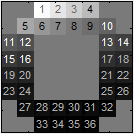
The table below shows the patch order for several grayscale targets. Use these orders when creating a custom density file (full instructions on Measuring test chart patches).
|
Standard Monochrome targets – Orientation and numbering of patches
|
|||
 |
 |
 |
 |
|
QA-61 ISO-
16067-1 Scanner |
QA-62
|
ST-51
EIA Grayscale (9×2) |
ST-52 ISO-14524
OECF target |
 |
 |
 |
|
|
ISO-15739
Noise target |
20-patch
OECF targets |
ITE Grayscale (11×2)
|
|
|
Imatest Specialized monochrome targets – Orientation and numbering of patches
|
|
 |
 |
|
SFRplus SQ-20 Grayscale Densities for patches 1-20: [0.95 1.05 1.45 1.25 |
36-Patch Dynamic Range chart |
You can find the patch order for any grayscale or color chart by running Color/Tone Interactive. For most of the charts on this page, select 7. Special Grayscale Stepcharts. Display 3. Split Colors: Reference/Input and check the Numbers checkbox. This displays the patch numbers, as shown below.
Color/Tone Interactive result, showing patch numbers


