Create test charts for high quality inkjet printers
Although we strongly recommend that customers purchase charts from the Imatest Store, the Imatest Test Charts module allows you to create test chart files for printing on high quality photographic inkjet printers. If you plan to print charts using this module, you should be skilled at fine printing and have a knowledge of color management to obtain optimum chart quality; otherwise we recommend purchasing charts at the Imatest Store.
Disclaimer: Although we sell most of the charts generated by the Imatest Test Charts module,
several variations are not available because
(A) it’s impractical for us to stock all charts, and (B) not all charts are equally useful or supported by Imatest.
To purchase charts that is not in our store, please send your request to charts@imatest.com.
Two types of chart can be created: bitmaps and Scalable Vector Graphics (SVG) files. A variety of options is available. You can select chart pattern, type (bar, sine, etc.), contrast, highlight color, printer gamma, and more.
To run Test Charts, run Imatest and click on in the Imatest main window. The following dialog box appears (shown here for the Star chart, which is part of the revised ISO 12233 standard). The available settings change for different patterns.
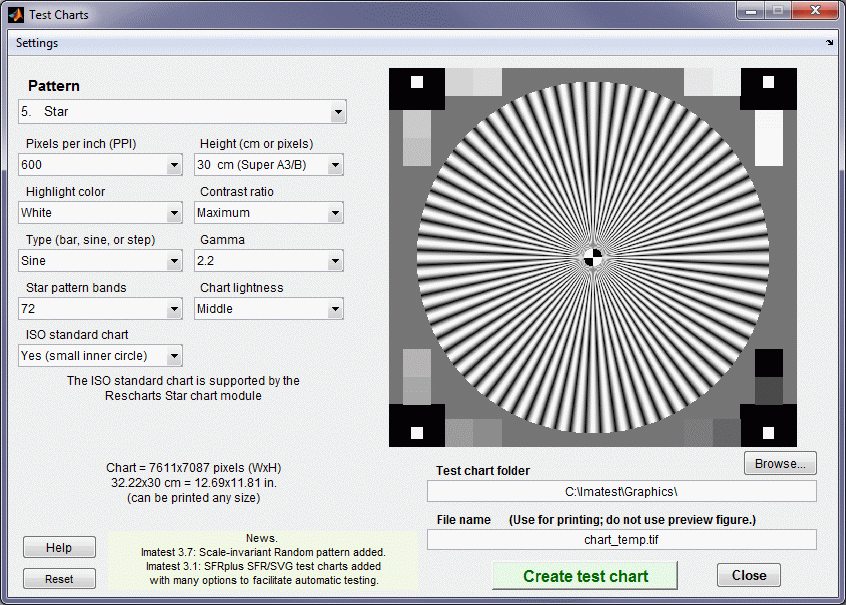
The file pixel size and the chart dimensions when printed at the specified PPI (bitmap files only) are shown on the lower left. Although these print dimensions result in optimum quality, the file may be printed at any desired size. Select the Pattern (the type of chart), the options, and the folder (directory) and file name for the test chart file. When you are ready to create the file, click on . You may cancel by clicking on . When the calculations are complete a preview figure showing the chart (not for printing) appears. You can zoom in to see the fine detail.
The figure with the image of the chart is for preview only: it shows you what the chart looks like and lets you zoom in if you want. Do not print the chart directly from this figure. Load bitmap Print Test output files (chart_temp.tif in the above example) into an image editor (such as Photoshop, Picture Window Pro, or Irfanview (a great free image viewer that can read and write nearly every known format)) and print it from the editor. SVG (Scalable Vector Graphics) files can be printed from Inkscape (or imported into Adobe Illustrator or Corel Draw). This will allow you to select the size of the print, add annotations, use color management, etc.
The best way to print the charts is to convert the TIFF files from black & white into 24-bit color and print them using a color-managed workflow with ICC profiles. Manufacturer-supplied profiles are often sufficient; custom profiles are better when tonal values are critical. SilverFast 8.5 – Printer Calibration is an excellent low-cost means of obtaining ICC printer profiles without a spectrophotometer— using a flatbed scanner calibrated with an It8.7 chart.
Bitmap patterns
Bitmap patterns consist of arrays of pixels stored as standard image files, in distinction to Vector graphic patterns (below). Bitmaps are best for continuous-toned images, especially the sine-modulated images in some of the patterns below.
The first three patterns, SFR:quadrants, SFR rectangles, and Distortion grid or checkerboard , are available in all versions. Most of the remaining patterns are available in Imatest Master only.
Print height can be selected in cm (for prints) or pixels (for standard video/screen sizes). Available print sizes are 25x18 cm (for A4 paper), 25x20 cm (for US letter paper), 40x28 cm (for A3 paper), and 40x30 cm (for Super A3/Super B paper). In addition, files can be created with the following sizes, which correspond to standard display resolutions: 640x480, 600x800, 768x1024, 960x1280, 1024x1280, and 1200x1600 pixels.
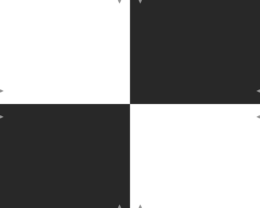
SFR: quadrants (All versions)This is the standard chart for SFR measurements. It should be tilted when it is photographed. Instructions are found in Using SFR, Part 1. Options include adjustment of pixels per inch (100 is recommended), contrast ratio (10 or 4 is recommended), gamma (2.2 is recommended for standard color spaces such as sRGB or Adobe RGB), and highlight color (usually white). |
 |
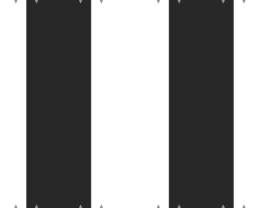
SFR: two rectangles (All versions)This chart is also used for SFR measurements. It should be cut into two segments (left and right sides) and tilted in a manner similar to the SFR quadrants chart, above, when photographed. Options are the same as SFR quadrants. |
 |
Distortion grid or checkerboard (All versions)Distortion grid… generates grid or checkerboard test charts for the Distortion module. (grid is shown on the right, but checkerboard is recommended.) Options include PPI, Highlight color, and Type (Grid or Checkerboard). Maximum contrast is always used. High resolution is not necessary. 100-300 pixels per inch is recommended. |
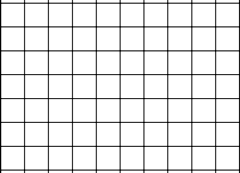 Distortion (grid)
|
| A portion of the input dialog box for the grid pattern is shown on the right. Several of the popup menu boxes are different for Distortion grid or checkerboard.Horizontal divisions and Vertical divisions are specified in the bottom two boxes. 10-20 Horizontal divisions works well in most cases. Vertical divisions has the option, “Square” that makes the grids square. This is the default, recommended in most cases.Checkerboard is recommended for most distortion measurements because line width is not an issue. The following paragraph only applies to grid patterns, where line width must be matched to image resolution.
For grid patterns, Line width (pxls) is typically set somewhere in the range of .01*PPI to .025*PPI. The printed line should be clear (not pale), but not very thick. 3 pixels is appropriate for a 150 PPI file. Lines in the preview image are thicker relative to the grid size than they are in the final image. The line width should be thick enough to cover at least two pixels in the captured image. Narrower lines may result in errors (Inconsistent number…). For example, suppose your captured image were 640x480 pixels (VGA). The line width (as shown on the right) would be 3 pixels out of a chart width of 1476. In the captured chart, the line width would be 640*(3/1476) = 1.3, inadequate for this small image size, though this chart would be perfectly adequate for 1+ megapixel cameras. |
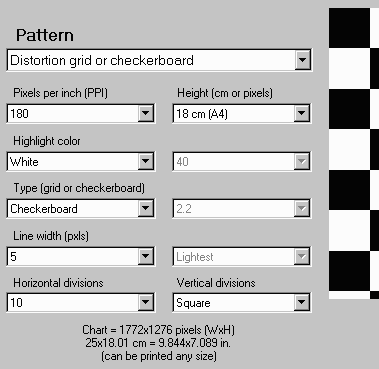
A portion of the Test Charts input dialog box |
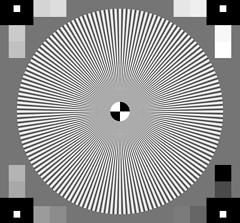
Star chart (Imatest Master only)This chart is also known as the Siemens star chart. Standard print sizes are 24×18 cm (for A4 paper), 26.67×20 cm (for US letter paper), 37.33×28 cm (for A3 paper), and 40×30 cm (for Super A3/Super B paper). Options include the number of star bands, sine or bar band pattern (sine shown on the right), pixels per inch (600 or 720 is recommended, depending on the printer), contrast ratio, gamma, and highlight color. Star charts can be used for observing performance (MTF, Moire patterns, and other image processing artifacts) at a variety of angles. In addition to the star (which has a selectable number of bands and either bar or sine form), the chart contains tonal calibration patches and slanted edges for checking results with SFR. The star chart included in the proposed update to the ISO 12233 standard can be analyzed with the Star Chart module in Imatest Master. It is generated with the following settings: PPI: 720 (Epson inkjets) or 600 (HP or Canon inkjets), Height (cm) (as required), Highlight color: White, Contrast ratio: >40, Type: Sine, Gamma: 2.2, Star pattern bands: 144 or 72, Chart lightness: Lightest to Mid-light, ISO standard chart: Yes or Yes (small inner circle): (inner circle will have 1/10 or 1/20 the diameter of the outer, respectively). |
Star chart (proposed ISO std) |
Log frequency-contrast gradient charts (or Stepcharts) (1 and 2-band charts in Imatest Master only)
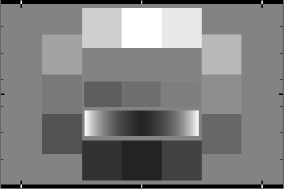
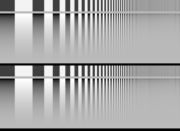
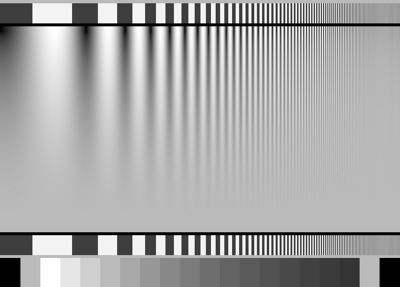
These charts display bar or sine patterns of increasing spatial frequency, for use with two Rescharts modules: Log Frequency and Log F-Contrast. Several features resemble the Koren 2003 test chart described in Lens testing (developed prior to Imatest).
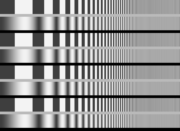
This chart is valuable for viewing Moiré fringing (colored bands caused by aliasing) and analyzing low contrast detail lost as a result of software noise reduction, which takes place inside the camera and/or RAW converter. Software noise reduction is a type of lowpass filtering (reduction of contrast at high spatial frequencies) that is turned on in regions where edges or strong image features are absent. Most cameras cannot distinguish noise from high-spatial frequency, low-contrast detail, located in the lower right of the 1 and 2-band charts. The two and four band charts are designed to be cut into segments to be placed around the target, possibly in different orientations (landscape, portrait).
 |
 |
 |
|
| Log F-Contrast chart | |
Each chart consists of the following patterns in 1, 2, or 4 bands. From top to bottom,
- A bar pattern of increasing spatial frequency (which could be used to determine spatial frequency (not used in Imatest).
- A sine or bar pattern of increasing spatial frequency (horizontally) for all charts and decreasing contrast (vertically) for 1 and 2-band charts. The contrast is proportional to the square of the distance from the bottom of this band. That emphasizes lower contrast areas, where noise reduction causes a loss of detail. It also corresponds to the way the eye sees, i.e., when the pattern contrast is one quarter of its maximum value, it appears to be about half the maximum. The contrast is constant for the 4-band chart, which is available in Imatest Studio.
- (1-band chart only) 20 rectangular patches. 1 and 20 are black (0,0,0), 2 and 19 are middle gray, and 3-18 (16 patches) are a stepchart with density steps of 0.1. If the chart is printed correctly, i.e., if printer gamma matches the Test Charts setting, these patches will closely match the first 16 patches of reflective step charts with 0.1 density steps such as the Kodak Q-13 and Q-14.
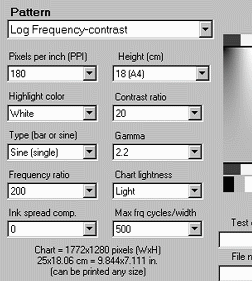
Options include
- Standard options: Pixels per inch (PPI; 600 or 720 is recommended, depending on the printer), Highlight color, Gamma, and Height. The standard print size is 25 x (approximately) 18 cm (9.83 x (approximately) 7.08 inches; A4 paper), 25 x (approximately) 20 cm (9.83 x (approximately) 7.87 inches; US letter paper), 40 x (approximately) 28 cm (15.7 x (approximately) 11.02 inches; A3 paper), 40 x (approximately) 30 cm (15.7 x (approximately) 11.8 inches; Super A3/Super B paper).
- Contrast ratio and Chart lightness: Do not affect patterns with vertically-varying contrast.
- Type: Bar or sine (single pattern), bar or sine (double pattern), or bar and sine without contrast variation (quad pattern; available in Imatest Studio). Sine is recommended for MTF measurements.
- Frequency ratio (maximum to minimum) See Log F-Contrast for recommendations.
- Maximum spatial frequency in cycles/width. (The actual spatial frequency will be detected by the analysis program.) See Log F-Contrast for recommendations.
The two Stepchart options include a chart with 20 steps (similar to the Kodak Q-13) and with16 steps with black and middle gray bands at the ends. Both have a density increment of 0.1. They can be printed any size (small or large) and sliced into narrow strips for specialized testing. Stepcharts should be printed with care in a color-managed environment. If an ICC profile is used for printing, Black Point Compensation should be turned off.
Zone plate (Imatest Master only; not analyzed by Imatest)
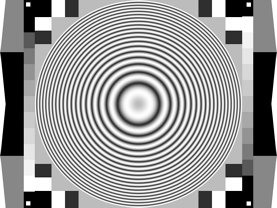
Zone plates (based on Fresnel diffraction) are useful for observing aliasing, particularly Moire patterns and other image processing artifacts. They have a much larger area of high spatial frequencies than the star chart. The spatial frequency is inversely proportional to the square of the radius (the distance from the center of the pattern). The chart also contains tonal calibration patches and slanted edges for checking results with SFR. Thanks to Bart van der Wolf, who has done some interesting work with zone plates.
Print sizes are the same as the star chart. Options include a divisor for the maximum spatial frequency (0.5 cycles per pixel at the outer radius when set to 1), sine or bar band pattern (sine shown on the right), pixels per inch, contrast ratio, gamma, and highlight color. Low ppi charts are useful for testing resizing performance.
Random (Scale-invariant) pattern (Imatest Master only)
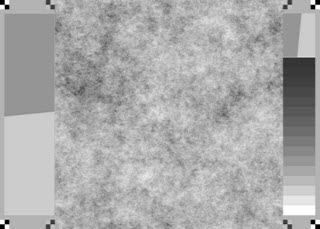 Random Scale-invariant pattern
This pattern is designed to work with the Random (scale-invariant) module, which features a random pattern whose general appearance is independent of viewing distance. (Its fourier transform is 1/f and its Power Spectral Density (PSD) is 1/f 2.)
Warning: The random chart can be tricky to print because many printer drivers apply smoothing algorithms (similar to noise reduction in cameras) that affect the actual printed spectrum.
Recommended settings for the module:
- Use standard values for PPI, Height, Gamma (usually 2.2), and Highlight color (usually White) based on printer resolution and print size.
- Contrast ratio: 40:1 recommended. There are few pixels at contrast extremes. The problems with contrasty edges are not an issue.
- Chart details: Show features on L & R. (important!)
- Chart lightness: Mid-light (not critical)
Other chartsTest charts can also create files for printing additional charts, including
Options for these charts are limited and self-explanatory. |
ISO 25739 noise chart |
Scalable Vector Graphics (SVG) patterns
| Imatest Master & IS SVG charts are discussed in detail in SVG (Structured Vector Graphics) Test Charts for improved MTF measurements. |
Vector graphic images consist of primitives such as lines, polygons, etc., that can be scaled to any size and do not suffer from the pixellation problems of bitmap images. They print at the printer’s maximum quality, regardless of size. Vector graphics are excellent for generating test charts consisting of lines, curves, and areas that don’t require complex tone variations such as sine modulation.
Scalable Vector Graphics (SVG) is an XML file format recognized by the World Wide Web Consortium (W3C). SVG files can be read, edited, and printed by Inkscape— an excellent free open-source program (described in Wikipedia). They can also be imported into Adobe Illustrator, Corel Draw, and others. SVG implementations are listed here.
Imatest Master can create several types of SVG chart, discussed in detail in SVG (Structured Vector Graphics) Test Charts. These charts include
- SFRplus charts, with many options (grid configuration, contrast, added graphics, etc.). These are the most important of the SVG charts. They are listed as SVG Squares mxn (e.g., 5×7) in the dropdown menu.
- SVG Squares & Wedges. Includes slanted-edges and hyperbolic wedges.
- USAF 1951 resolution chart (somewhat simplified; numbers omitted). For visual judgment. Not for Imatest analysis.
- Polka-dot pattern, used for I3A CPIQ-compliant measurements of distortion and lateral chromatic aberration in Dot Pattern.
- ISO-12233:2014 (low contrast 4:1 edges), compliant with the ISO-12233:2014 standard, supported by the eSFR ISO module. Several options are available.
- Checkerboard pattern with optional dots near the center for geometrical information when used with the Checkerboard module.
- Registration mark pattern (circle with four light/dark quadrants inside) for use with SFRreg.
Here is an example of a 5×9 SFRplus chart with a grayscale pattern and a focus star. Primary contrast is 10:1; secondary contrast is 2:1.
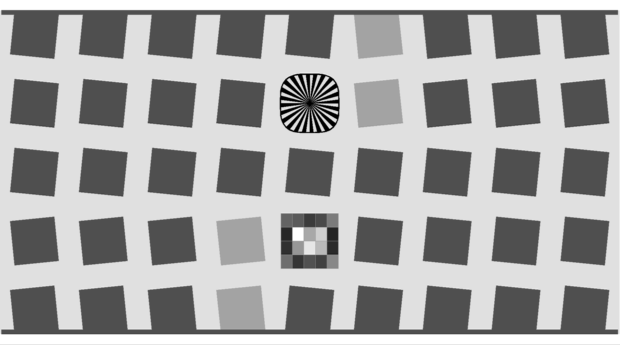
SVG SFR chart: 5×9 grid (for SFRplus), 10:1 and 2:1 contrast
with grayscale (0.1 density increment) and focus star
This chart should be printed at least 24 inches high (with some white space at the top and bottom) to ensure adequate chart resolution for cameras up to about 15 Megapixels. Larger charts (60 or 72 inches wide) are recommended for higher resolution cameras.
Options
Pixels per inch (PPI)
(bitmap charts only) Choices: 720, 600, 400, 360, 320, 300, 180, 150, 120, 100, 72
Along with chart height, PPI determines the size of bitmap test chart image files. For the two SFR charts (1 and 2 above) it can be a low number— 100 PPI, because there are only vertical and horizontal edges. For the Star, Log frequency, and Zone plate charts, the native DPI (dots per inch) of the printer is recommended: 720 for Epson printers (1440 or 2880 dpi); 600 for Canon or HP (1200, 2400, etc. DPI). For optimum results (best resolution) the chart should be printed at exactly these DPI settings (total size is shown in the Test Charts window). High resolution files can be somewhat slow to create.
Chart height
(bitmap charts only) Choices: 30 (Super A3/B), 28 (A3), 20 (US Letter), 18 (A4)
The intended height of printed bitmap charts, assuming landscape format (where width > height). The chart can be printed any size, but when it is printed at the intended height, the the specified PPI (above) is sent to the printer. This gives optimum results. The width is larger than the height by a roughly 4:3 ratio (depending on the pattern). The specified heights are 18 cm (7.08 inches; A4 paper), 20 cm (7.87 inches; 11x8.5 inch US letter paper), 28 cm (11.02 inches; A3 paper), and 30 cm (11.8 inches; 19x13 inch Super A3/Super B paper).
Highlight color
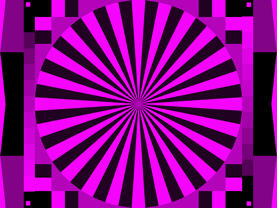
In addition to the standard White/Black (or White/Gray) charts, you can replace white with any additive or subtractive primary color: R, G, B, C, M, or Y.
Different colors may be of use for analyzing Bayer sensors, where alternate rows of pixels are sensitive to {R, G, R, B, R, …} and {G, B, G, B, G, …}. Since there are only half as many R and B sensors as green sensors (and one quarter as many as total pixels), one would expect MTF to be poorer for red-black and blue-black charts than for white-black). Demosaicing algorithms typically make use of different colored pixels for calculating detail (i.e., an edge in the red channel would be sharper if information is present in the other channels). Also, different algorithms perform differently. A lot can be learned from targets of different colors.
Chart lightness
Choices: Lightest, Light, Mid-light, Middle, Mid-dark, Darkest
Determines the grayscale level of both the light and dark areas of the chart. Useful with charts that contain grayscale information (star, zone plate, and Log frequency patterns with sine modulation), where best pattern quality can be obtained if this setting is not “lightest” (highlights pure white). Also valuable for SFR edge charts, where middle tones are likely to be in the camera’s linear response region.
Contrast ratio
Choices: None, Maximum, 80, 50, 40, 25, 20, 10, 5, 4, 2, 1.414, 1.2, 1.1
The ratio of the reflectivity of the light to dark areas (the upper zone only in the Log frequency chart). The maximum contrast ratio depends on the printer and paper. It is typically around 100 for glossy (or luster) surfaces, but only around 40 for matte surfaces. Maximum print density = -log10(minimum reflectivity) can be measured in Print Test or estimated by Gamutvision. Available selections are Maximum and 80 through 1.1.
Clipping is often a problem with high contrast targets. The ISO-12233 standard calls for a contrast ratio between 40 and 80, but recent experiments have shown that lower contrast ratios produce more accurate and consistent results, which are less affected by gamma and camera nonlinearities. In 2007 the ISO standard will change to recommend lower contrast chart. The default value for Test Chart is 40 (the minimum recommended in the ISO standard), but 20 is preferred in many cases.
Contrast ratio affects MTF (SFR) measurements in cameras that perform nonlinear signal processing, i.e., noise reduction and sharpening with thresholds— nearly universal in consumer cameras. Charts with at least two contrast ratios: 20 and 2 (or lower) are recommended for characterizing cameras.
Gamma
Choices: 2.5, 2.2, 2.0, 1.8, 1.5, 1.0
You should use the value of gamma for your typical color space and workflow (2.2 is standard for Windows; 1.8 for older Mac systems). The default value is 2.2. Gamma affects the accuracy of sine patterns and the actual printed contrast ratio: it must be the same value used for printing (the value of the color space, i.e., 2.2 for Adobe RGB (1998), if color management is used) to get the correct contrast ratio.
Ink spread compensation
corrects for ink spread (or “dot gain”) in the Log frequency chart. (The Star chart may be added later.) The best value has to be determined experimentally. (Not used much recently.)
Output figure
The output figure contains an image of the test chart. It is not anti-aliased, hence lines may be missing (in Grid) or curious aliasing patterns may appear, visible below. Only the circle in the middle is real– all the others are the result of aliasing.
This figure is not intended for printing. To print a chart open the image file (C:ImatestData_distortionchart_temp.tif in the example below) in an Image editor and print it from the editor. A high quality (photographic) inkjet printer is recommended. The best way to print the charts is to convert the TIFF files from black & white into 24-bit color and print them using a color-managed workflow with ICC profiles. Manufacturer-supplied profiles are often sufficient; custom profiles are better when tonal values are critical. SilverFast 8.5 – Printer Calibration is an excellent low-cost means of obtaining ICC printer profiles without a spectrophotometer— using a flatbed scanner calibrated with an It8.7 chart.
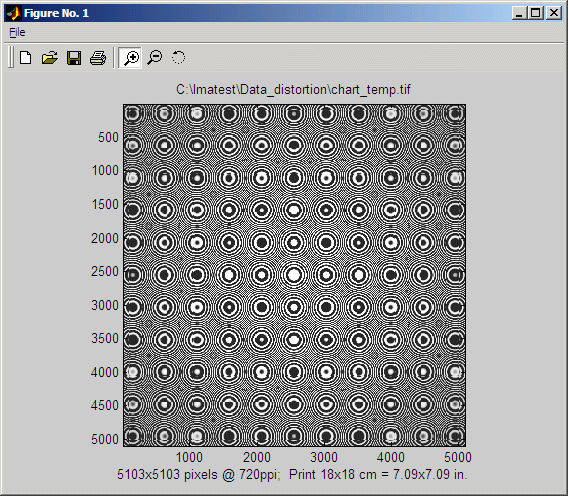
Preview image of Zone plate showing extreme Moiré
You can zoom in on the chart by selecting an area or clicking on a point of interest. Double-clicking restores the complete image.
Measuring and calibrating the charts
A procedure for measuring the grayscale and color patches in test charts is given in Measuring test chart patches. The CGATS files produced by these measurements can be read by any of the Imatest modules that analyze color or grayscale charts: Color/Tone Interactive, Colorcheck, Stepchart, Rescharts (SFRplus), or MultiTest.


